
|
|
|
K-12 Private Schools ... characteristics of individual K-12 private schools
This section provides information for each of the 26,983 K-12 private schools that provided student, staff and operating data for the 2011-12 school year. The total enrollment in these schools was 4,002,695 with 372,269 teachers. The data have been developed from a nationwide survey of all U.S. K-12 private schools. Use GIS resources reviewed in this section to examine these schools in context of other schools, school membership and political/statistical geographic areas (e.g., cities, school districts, census tracts, etc.). Analyze school locations in context of demographic-economic patterns and trends to assess opportunities and for strategic planning. Selected items are presented for each school in the interactive ranking table shown below. Use the ranking table to examine characteristics of individual schools in context of U.S. overall, states and by other geography. Query/rank schools based on selected criteria. National Summary Characteristics -- scroll section 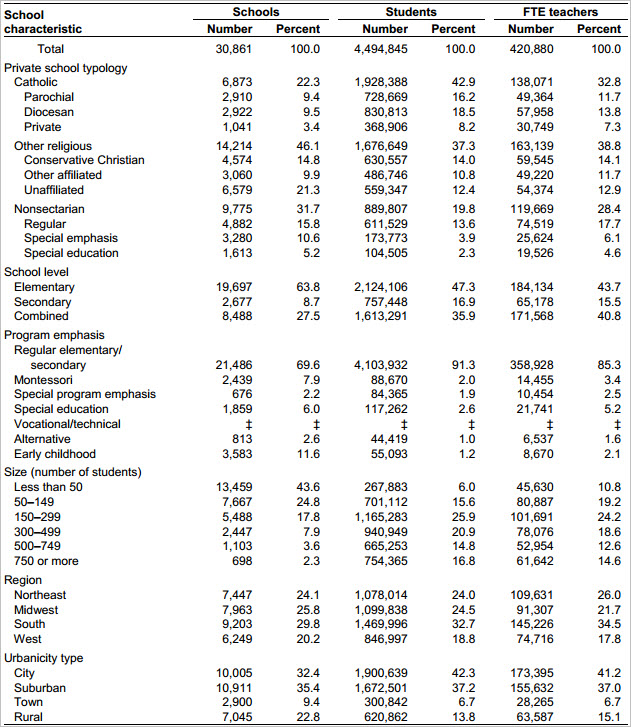 Visual Analysis of K-12 Private Schools Red markers show private school locations in New York City area. 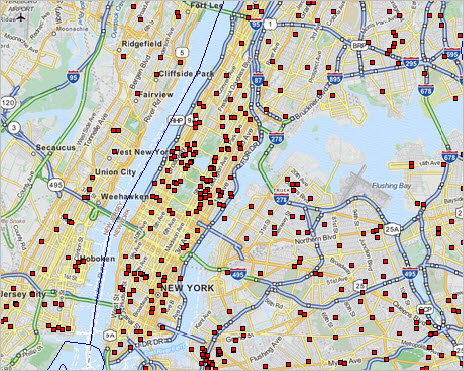 View created using CV XE GIS. Click graphic for larger view. Click to view zoom-in of above view with detail. ... GIS view using identify tool to show attributes of a selected school (at pointer). ... Census tracts (red boundaries) labeled tract median household income. Click to similar map for Punahou School, Honolulu. ... Tracts labeled with tract percent high school graduates (population 25 years and over). K-12 Private Schools -- Interactive Table Click ShowAll button between Find/Queries. See ranking table usage notes below ranking table. See related ranking tables -- http://proximityone.com/rankingtables.htm. Using the Ranking Table Query by Type Click Type button and select 7 to view only non-sectarian schools. Scroll to table bottom to see that there are 4,241 non-sectarian schools. Scroll to top of table and click header "Enrl Total" column (far right) twice (ascend and then descend on second click). ... note that "Schl Type" column now contains only value 7 (non-sectarian). ... see that Punahou School (Hawaii) is largest non-sectarian school in U.S. with enrollment of 3,743 ... click to view Punahou School location/map. - GIS view using identify tool to show attributes of school (at pointer). - Census tracts (red boundaries) labeled with tract percent high school graduates (population 25 years and over). See alternative "type" values below. Operations more generally: • Click on a column header to sort on that column; click column header again to sort in other direction. • Click ShowAll button to show all schools and restore full set of data view. • Click State to select all schools in a selected state (click ShowAll between selections). • View additional rows/schools by sliding vertical scrollbar at table right. • Modify column width by dragging column separator in header row. • View additional columns by sliding horizontal scrollbar (leftmost columns remain fixed). Column Headers • Name - School Name • City - School City • St - State USPS Code • ZIP - ZIP Code • Locale - locale code is an indicator of school location area urbanization
11 City, Large
• Low Grade12 City, Midsize 13 City, Small 21 Suburb, Large 22 Suburb, Midsize 23 Suburb, Small 31 Town, Fringe 32 Town, Distant 33 Town, Remote 41 Rural, Fringe 42 Rural, Distant 43 Rural, Remote • High Grade • Type/Typology
1 Catholic, parochial
• Relig - Religious Affiliation2 Catholic, diocesan 3 Catholic, private 4 Other Religious, Conservative Christian 5 Other Religious, affiliated 6 Other Religious, unaffiliated 7 Nonsectarian, Regular 8 Nonsectarian, special emphasis 9 Nonsectarian, special education – Nonsectarian 1 Catholic 2 Other religious 3 Nonsectarian • Orientation
1 Roman Catholic
• Level - Elementary, Secondary, Combined2 African Methodist Episcopal 3 Amish 4 Assembly of God 5 Baptist 6 Brethren 7 Calvinist 8 Christian, no specific denomination 9 Church of Christ 10 Church of God 11 Church of God in Christ 12 Church of the Nazarene 13 Disciples of Christ 14 Episcopal 15 Friends 16 Greek Orthodox 17 Islamic 18 Jewish 19 Latter Day Saints 20 Lutheran Church - Missouri Synod 21 Evangelical Lutheran Church in America 22 Wisconsin Evangelical Lutheran Synod 23 Other Lutheran 24 Mennonite 25 Methodist 26 Pentecostal 27 Presbyterian 28 Seventh-day Adventist 29 Other 30 Nonsectarian • Students • %Male • Teachers (FTE) • Student-Teacher Ratio • %White • %Black • %AmInd/AN • %Asian • %NHPI • %2Plus • Hispanic Additional Characteristics -- scroll section
In the fall of 2011, there were 30,861 private elementary and secondary schools with
4,494,845 students and 420,880 full-time equivalent (FTE) teachers in the United States.
Sixty-eight percent of private schools, enrolling 80 percent of private school students and employing 72 percent of private school FTE teachers in 2011–12, had a religious orientation. Seventy percent of private schools emphasized a regular elementary/secondary program, 8 percent emphasized a Montessori program, 2 percent emphasized a special program emphasis, 6 percent emphasized a special education program, 3 percent emphasized an alternative program, and 12 percent emphasized an early childhood program. There were more private schools in suburban locations (10,911), compared to those in cities (10,005), followed by those in rural areas (7,045), and then by those in towns (2,900) More private school students were enrolled in schools located in cities (1,900,639), followed by those enrolled in suburban schools (1,672,501), followed by those in rural areas (620,862), and then by those in towns (300,842). More private school students were enrolled in kindergarten (449,819) than in any other grade level The average school size was 146 students across all private schools. Private school size differed by instructional level. On average, elementary schools had 108 students, secondary schools had 283 students, and combined schools had 190 students. Forty-four percent of all private schools enrolled fewer than 50 students. Seventy-one percent of private school students were White; 10 percent were Hispanic or Latino, regardless of race; 9 percent were Black or African American; 5 percent were Asian; 3 percent were of two or more races, and less than 1 percent was American Indian or Alaska Native, or Native Hawaiian or other Pacific Islander, respectively. Ninety-six percent of all private schools were coeducational, while 2 percent enrolled all girls and 2 percent enrolled all boys. Seventy-eight percent of private school teachers were full-time teachers; 5 percent taught less than full time, but at least three-quarter time; 9 percent taught less than three-quarter time, but at least one-half time; 5 percent taught less than one-half time, but at least one-quarter time; and 3 percent taught less than one-quarter time. The average pupil/teacher ratio was 10.7 across all private schools. The average pupil/teacher ratio was lower in combined schools (9.4) than in elementary schools (11.5) or secondary schools (11.6) Ninety-eight percent of 12th-graders enrolled in private schools around October 1, 2010 graduated by the fall of 2011. Of the 305,842 private high school graduates in 2010–11, some 64 percent attended 4-year colleges by the fall of 2011. There were 10,212 private schools that did not report membership in any private school association. There were 200,000 or more students enrolled in private schools in each of California, Florida, Illinois, New York, Pennsylvania, and Texas. Support Using these Resources Learn more about demographic economic data and related analytical tools. Join us in a Decision-Making Information Web session. There is no fee for these one-hour Web sessions. Each informal session is focused on a specific topic. The open structure also provides for Q&A and discussion of application issues of interest to participants. ProximityOne User Group Join the ProximityOne User Group to keep up-to-date with new developments relating to children's demographics and school district decision-making information resources. Receive updates and access to tools and resources available only to members. Use this form to join the User Group. Additional Information ProximityOne develops geographic-demographic-economic data and analytical tools and helps organizations knit together and use diverse data in a decision-making and analytical framework. We develop custom demographic/economic estimates and projections, develop geographic and geocoded address files, and assist with impact and geospatial analyses. Wide-ranging organizations use our tools (software, data, methodologies) to analyze their own data integrated with other data. Follow ProximityOne on Twitter at www.twitter.com/proximityone. Contact ProximityOne (888-364-7656) with questions about data covered in this section or to discuss custom estimates, projections or analyses for your areas of interest. |
|
|