
|
|
|
World by Country, State, Place, Urban Area ... Visualize world geographic-demographic-economic characteristics using tools resources described in this section. Zoom-in to any region of the world and examine political/statistical geography. This section provides illustrative views of the world by country, and drill-down geography, developed using the World GIS project. Install the World GIS project on your computer using the steps described below. Create alternative thematic pattern views, label and view selected geography to meet your needs, add your own data ... Geographic Information Systems (GIS) resources enable you to examine how countries, their states/provinces and lower level geography relate to one another. By integrating subject matter data, such as demographics, thematic maps can be developed that provide insights into patterns. North America by State/Province The World GIS project integrates multi-sourced geographic data. The following view shows portions of North America by integrating Census Bureau sourced TIGER/Line shapefiles, Canada and Mexico by state/province shapefiles and OpenStreetMaps as a base layer. Urban areas are shown with orange fill pattern. Using the GIS resources, modify the zoom view, add labels, remove/add layers. 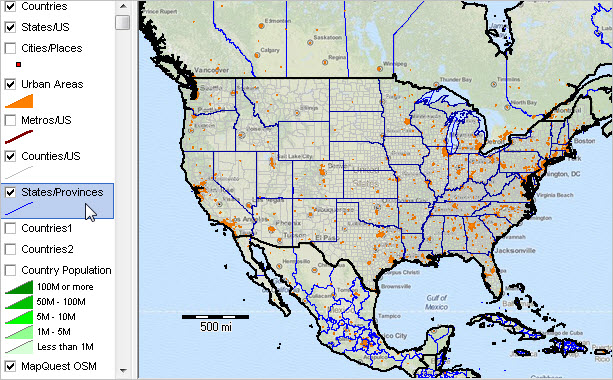 Countries of Europe; Population Characteristics The following view shows population thematic pattern. See color/interval setting in legend at left of map. Using the GIS resources, modify the intervals and colors to meet preferences. Each country is labeled with population (millions) and country name. 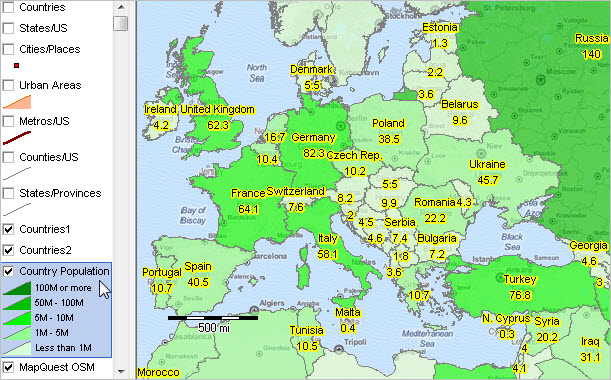 Zoom-in to France and Vicinity; City/Places & Urban Areas The following view shows city/places (red marker) and urban areas (orange fill pattern). 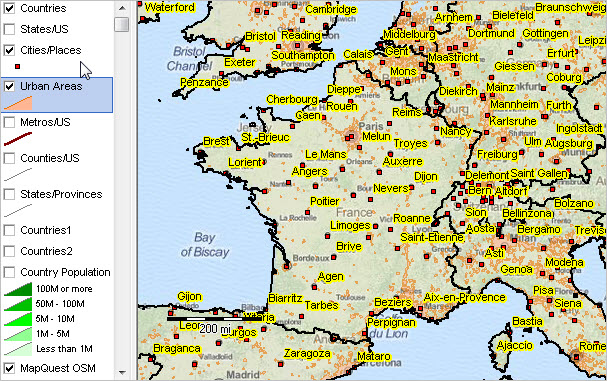 Zoom-in to Paris with Starbucks Locations Add your geocoded address data in the form of a shapefile to the World GIS project. View/analyze your locations of interest anywhere in the world contextually with other data. The view below shows selected Starbucks Coffee locations (red markers) in the Paris area. Click for larger view that illustrates street level detail available. The larger view shows the Starbucks locations as green markers with location names as labels. 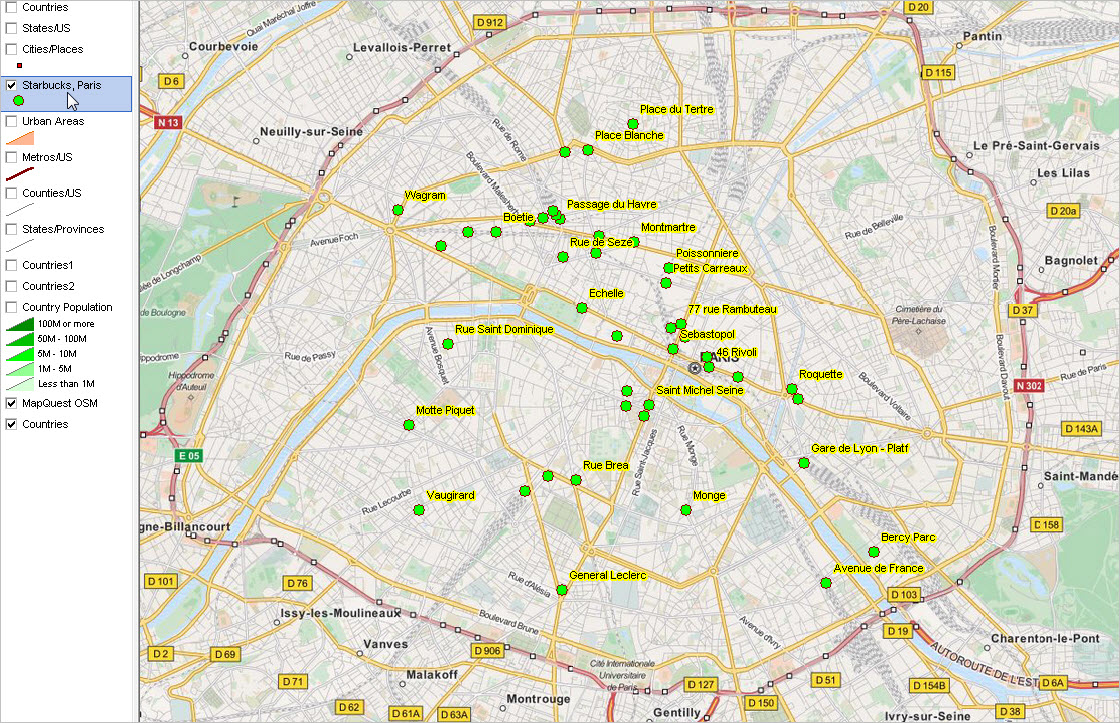 Africa by Country and Arabian Peninsula Region Countries labeled with population in millions. Using the optional CV Site Analysis tool to perform geospatial analysis; combine selected country provinces to examine demographic characteristics. 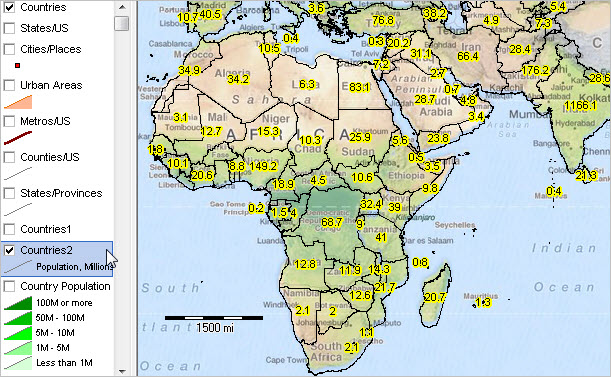 India by Province The following view shown India in context of region with states shown as red boundary and labeled with state name. This view illustrates use of a query applied to the world by state/province layer/shapefile so that only those of India are visible. Optionally zoom-in and turn-on the urban layer to view drill-down characteristics of India. 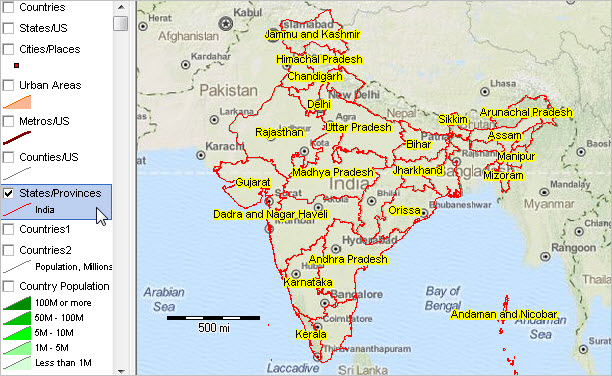 Use the World by Country GIS Project 1. Install the ProximityOne CV XE GIS (only required if not already installed) ... run the CV XE GIS installer ... take all defaults during installation 2. Download the World by Country GIS Project Level 1 fileset ... requires ProximityOne User Group ID (join now) ... unzip World by Country Level 1 project files to local folder c:\world 3. Open the c:\world\world20151.gis project ... after completing the above steps, click File>Open>Dialog ... open the file named c:\world\world20151.gis 4. Done. Start-up view appears. ProximityOne User Group Join the ProximityOne User Group to keep up-to-date with new developments relating to metros and component geography decision-making information resources. Receive updates and access to tools and resources available only to members. Use this form to join the User Group. Support Using these Resources Learn more about accessing and using demographic-economic data and related analytical tools. Join us in a Data Analytics Lab session. There is no fee for these one-hour Web sessions. Each informal session is focused on a specific topic. The open structure also provides for Q&A and discussion of application issues of interest to participants. Additional Information ProximityOne develops geodemographic-economic data and analytical tools and helps organizations knit together and use diverse data in a decision-making and analytical framework. We develop custom demographic/economic estimates and projections, develop geographic and geocoded address files, and assist with impact and geospatial analyses. Wide-ranging organizations use our tools (software, data, methodologies) to analyze their own data integrated with other data. Follow ProximityOne on Twitter at www.twitter.com/proximityone. Contact us (888-364-7656) with questions about data covered in this section or to discuss custom estimates, projections or analyses for your areas of interest. |
|
|