
|
|
|
-- creating custom maps and GIS projects; part 1 While maps are "everywhere," there is a continuing need to make new maps. Reasons for this include changing underlying geography, new features (like stores or customers to be viewed), visually examining geographic relationships not available elsewhere (e.g., census tracts and ZIP codes), different geographic depictions for an area (smoothed versus precise vertices) and other reasons. A map can provide view(s) that relate to geospatial analysis; map visualization can be indispensable (showing road features adjacent to selected properties). View of Initial Map Objective -- University Park, TX; Dallas Metro area Census tracts (black boundary) shown with census tract code as label. 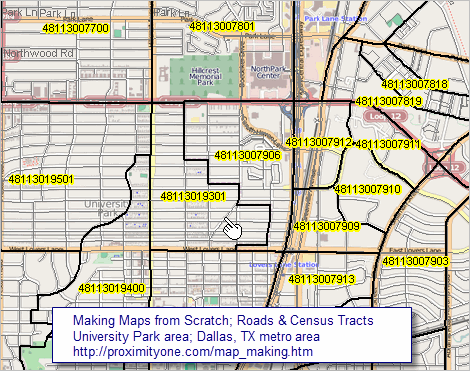 -- view developed using CV XE GIS software Follow steps in this section to make a map like above for any area in the U.S. This section provides an overview of how to use the CVGIS software to quickly build a map. It is actually more than a map, it is the process of building a GIS project. A map is one rendering that can be displayed, and optionally published, using a GIS project. Map/GIS project development steps reviewed here can be performed using the no fee CVGIS software and no fee data resources, CVGIS Levels 1 and higher can save the GIS project and have additional geography available. With geographic extension, the process illustrated here can work for any place in the world. A GIS project is a file itself that contains references to map files (shapefiles) located on your computer. Once a GIS project has been created and saved, it can be immediately opened with CVGIS using the File>Open operation. After turning your computer off, and restarting it, the GIS project can be re-opened to display the same view as saved in an earlier session. No Previous GIS/Mapping Experience Required This section is designed for use by anyone including those with no previous GIS/mapping experience. Requirements are a Windows computer and Internet access. This section is a part of a module used in the Certificate in Data Analytics and the CVGIS Certification Programs. Developers can also benefit from this and related tutorials to learn more about how GIS can be integrated with other data analytics tools and methods. Making Maps Steps The objective of this session is to develop a map (and GIS project) to view characteristics of census tract "48113019301". The first step in making a map (GIS project) is to have a clear objective. This 11 character geocode uniquely identifies this Census 2010 census tract among all other 73,057 tracts in the U.S. See more about census tract geography and geocodes. While this application shows a process for adding only two layers, it could be extended by adding more. Similarly, while this application uses a census tract boundary files (shapefile), alternatives are census blocks, block groups, ZIP code areas, among others. These steps should take an inexperienced user 10-15 minutes to develop a new CVGIS project view. If anything becomes confused, close the program and start over. 1. Install CVGIS (1/1/2017 or later version) 2. Open Base Project 3. Get Census Tract Shapefile 4. Get Roads Shapefile 5. Modify Map View 6. Optionally Save GIS Project 1. Install CVGIS • Run the CVGIS Installer. • Omit this step is CVGIS already installed. .. see about checking the date of the installed version. .. this tutorial requires a CVGIS version dated 1/1/17 or more recent. 2. Start CVGIS & Open Base Project • At completion of installation, CVGIS automatically starts. • If CVGIS has been previously installed, start CVGIS using the desktop icon. • From the main menu, select File>Open>Dialog. • In the dialog, open the GIS base project: c:\cvgis\1\base.gis. The base.gis project is a reusable start/base project. The start view shows the U.S. in context of the world. It is suggested that the base.gis project not be saved with that name. If saving the project, use a different name. 3. Get the census tract shapefile See about using the Gateway-Geographic Data in the User Guide for more information about these steps. • If not running, start CVGIS (use desktop icon). • From the main menu, start the Gateway>Geographic Data • See the Geographic Data form in the above link view. • In top left panel "1. Select Geographic Scope" enter .. scroll down to Dallas County and click that selections. • In top right panel "2. Select Shapefile/Geofile Type" dbl-click Census Tracts >41 • Click Download button .. click Continue button when it appears .. click OK button when it appears .. click OK button when it appears (second time) .. when message "Done. 1-Modify settings/download another, 2-add layer, 3-close form" .. click checkbox on for "Set GIS Extent to this Layer Extent" option. .. change Shape Label to GEOID .. Add Layer to Project button. • Keep this form open as you proceed to Step 4. 4. Get the roads shapefile • In top right panel "2. Select Shapefile/Geofile Type" dbl-click Edges/Roads >38 • Click Download button .. click Continue button when it appears .. click OK button when it appears .. click OK button when it appears (secind time) .. when message "Done. 1-Modify settings/download another, 2-add layer, 3-close form" .. click checkbox on for "Set GIS Extent to this Layer Extent" option. .. change Shape Label to GEOID. .. Add Layer to Project button. • Close the GeoGateway form. 5. Modify the Map View The map window now shows Dallas County. • Uncheck the top layer (roads) in the legend panel • Use the GIS Tools>Find Shape to locate the tract of interest. 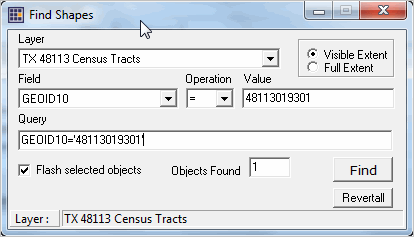 The tract flashes yellow. • Use the Zoom tool to zoom-in to the tract of interest. 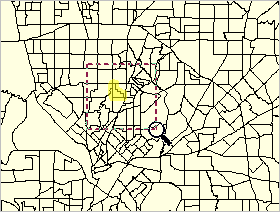 After zoom-in, • Check roads layer in the legend panel; roads layer now appears. • Check Base layer in the legend panel; base layer now appears. The view should now be similar to the view at the top of this section. Next Steps Try the process yourself with geography of interest to you. View/use other "Creating Maps & GIS Projects" tutorials to learn about: • integrating subject matter • developing and using thematic maps • creating site profiles Support Using these Resources Learn more about accessing and using demographic-economic data and related analytical tools. Join us in a Data Analytics Lab session. There is no fee for these one-hour Web sessions. Each informal session is focused on a specific topic. The open structure also provides for Q&A and discussion of application issues of interest to participants. ProximityOne User Group Join the ProximityOne User Group to keep up-to-date with new developments relating to metros and component geography decision-making information resources. Receive updates and access to tools and resources available only to members. Use this form to join the User Group. Additional Information ProximityOne develops geodemographic-economic data and analytical tools and helps organizations knit together and use diverse data in a decision-making and analytical framework. We develop custom demographic/economic estimates and projections, develop geographic and geocoded address files, and assist with impact and geospatial analyses. Wide-ranging organizations use our tools (software, data, methodologies) to analyze their own data integrated with other data. Follow ProximityOne on Twitter at www.twitter.com/proximityone. Contact us (888-364-7656) with questions about data covered in this section or to discuss custom estimates, projections or analyses for your areas of interest. |
|
|