
|
|
|
School District Population & Poverty -- 2022 -- examining districts where children might be more challenged to achieve higher levels of educational attainment
December 2023. In 2022, 12.6% of the United States population 325,521,470 for whom poverty status was determined or 40,951,625 were in poverty. Among the school districts with total population 5,000 or more (8,127), there were 4,227 districts with a percent grade relevant school age children with a poverty rate above 12.6%. Use the interactive table below to view, sort, rank, query U.S. national scope school district 2022 population and income characteristics. Percent Grade Relevant Children in Poverty by School District, 2022 The yellow interval, 12-13%, corresponds to the U.S. national poverty rate. Blue and green patterns are below national rate; salmon and red color patterns are above the national rate -- areas where children might be more challenged to achieve better levels of education and higher levels of educational attainment. 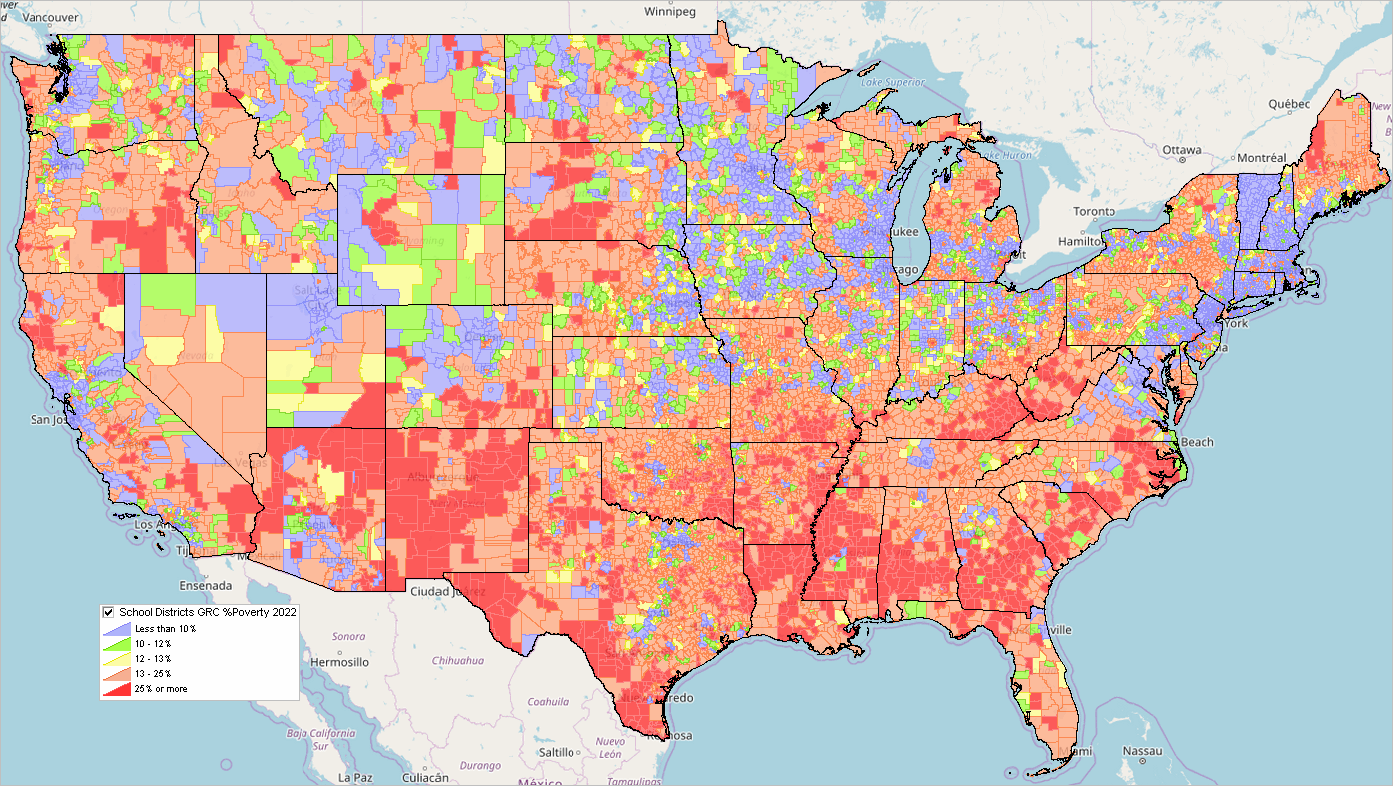 .. click graphic for larger view; expand to full windoe for best quality view. The Small Area Income and Poverty Estimates (SAIPE) program provides annual estimates of income and poverty statistics for all school districts, counties, and states. The main objective of this program is to provide estimates of income and poverty for the administration of federal programs and the allocation of federal funds to local jurisdictions. In addition to these federal programs, state and local programs use the income and poverty estimates for distributing funds and managing programs. An important feature of these estimates is that they provide and alternative current estimate of median household income ($MHI) for all counties. These data are the only Federal source of current year median household income for all counties. The SAIPE program produces the following county and state estimates: total number of people in poverty • number of children under age 5 in poverty (for states only) • number of related children ages 5 to 17 in families in poverty • number of children under age 18 in poverty • median household income In order to implement provisions under Title I of the Elementary and Secondary Education Act as amended, the SAIPE data also include data for each school district: • total population • number of children ages 5 to 17 • number of grade relevant related children ages 5 to 17 in households in poverty Related Sections .. the School District Community .. interactive tables • Children's Demographics by school district • School District Enrollment & Administrative Characteristics School District 2022 Demographic Estimates Interactive Table .. goto top SAIPE 2022 year model based Use mouseover on header column to view extended item/column name. Click ShowAll button between Find/Queries. See usage notes below table. Usage Notes • Click ShowAll button between queries; this resets the table. • Click on a column header to sort on that column; click column header again to sort in other direction. • Click State to select on geographies in a selected state (click ShowAll between selections). Click Group buttons below table to view only districts specfied in 5 edit boxes. Change the edit box values to select districts of interest. Modified district codes are not save when HMTL page exited or refreshed. About these Data .. goto top The school districts for which estimates are available are those identified in the 2023 school district mapping survey, which asked about all school districts as of January 1, 2023 and used school district boundaries for the 2022-2023 school year. The 2022 estimates are consistent with the population controls and income concepts used in the 2022 American Community Survey single-year estimates. Support Using these Resources .. goto top Learn more about accessing and using demographic-economic data and related analytical tools. Join us in a Data Analytics Lab session. There is no fee for these one-hour Web sessions. Each informal session is focused on a specific topic. The open structure also provides for Q&A and discussion of application issues of interest to participants. ProximityOne User Group .. goto top Join the ProximityOne User Group to keep up-to-date with new developments relating to geographic-demographic-economic decision-making information resources. Receive updates and access to tools and resources available only to members. Use this form to join the User Group. Additional Information ProximityOne develops geographic-demographic-economic data and analytical tools and helps organizations knit together and use diverse data in a decision-making and analytical framework. We develop custom demographic/economic estimates and projections, develop geographic and geocoded address files, and assist with impact and geospatial analyses. Wide-ranging organizations use our tools (software, data, methodologies) to analyze their own data integrated with other data. Contact ProximityOne (888-364-7656) with questions about data covered in this section or to discuss custom estimates, projections or analyses for your areas of interest. |
|
|