

|
|
-- geographic information systems & geospatial analysis -- for use with Windows operating system installed on your computer -- for use with Mac OS and iOS with only a browser .. nothing to install -- part of the VDA Framework VDA Desktop GIS (VDAGIS) is a Windows-based Geographic Information System (GIS) designed for use by those with no GIS/mapping experience to more advanced analysts and developers. VDAGIS includes features similar to the VDA Web GIS and provides an extended range of capabilities, flexibility and security. VDA Web GIS provides the convenience of being accessed with only a Web browser, using most any device, nothing to install, and supported with a wide range of GIS projects. This section provides an overview of VDA Desktop GIS and instructions for installation and getting started. VDA GIS tools have been developed and are maintained/supported by Warren Glimpse/ProximityOne/Alexandria, VA USA and Takashi Hamilton/Tsukasa/Osaka, Japan. Using VDA GIS .. if you are not already a VDA GIS user, join the VDA User Community now. Start with the no fee Viewer or a more powerful version/level. Use VDA Desktop GIS alone or in combination with VDA Web GIS. As a member of the VDA User Community will gain insights into new, updated data resources; augment the scope of your decision-making information. Contact us by e-mail or call (888-364-7656) for more information. Topics
01 Using this Document; Support Click on a link in the topics menu above to go to a focus section. The Levels and Features section provides provides an organized list of features by level that includes links to more detailed feature descriptions. Support. Our broad and detailed knowledge of geographic, demographic and economic data sets us apart from other GIS tools and solutions. From day one as a VDA GIS user we share this knowledge with you, via Web sections, blogs, web sessions, and direct one-on-one support. E-mail us or call (888-364-7656) with questions and for help. 02 News & Updates .. goto top • See Calendar for news and updates. • What's New to query by keyword. 03 Installation, Updates and Version .. goto top Using VDAD via Remote Desktop Service The no-installation route .. use VDAD on our server using Remote Desktop Service .. the same features but nothing to install. VDAD RDS enables users to use VDAD with only a browser and mosr any device/operating system, like Mac OS and iOS devices. Installation on Windows Computer The VDA Desktop GIS installer works for all versions of the VDA Desktop GIS software on a Windows computer. A user ID/key enables access to authorized features. VDAGIS has a built-in updating feature. When "Update" appears in the lower left part of the user interface, an update is available. Dbl-click on "Update" to automatically install the latest version. VDAGIS will restart automatically. The VDAGIS version is shown at the top of the VDAGIS user interface. For example, "VDAGIS Version 05.15.23" shows that the version released in month 5, day 15, year 2023, iteration 0 is in use. 04 Start-Up View; Overview and Getting Started .. goto top The default "us1.gis" project is installed by the installer. The start-up view is shown in the following graphic. The main menu and toolbar are shown at the top, legend panel at the left and map window at the right; most of view. 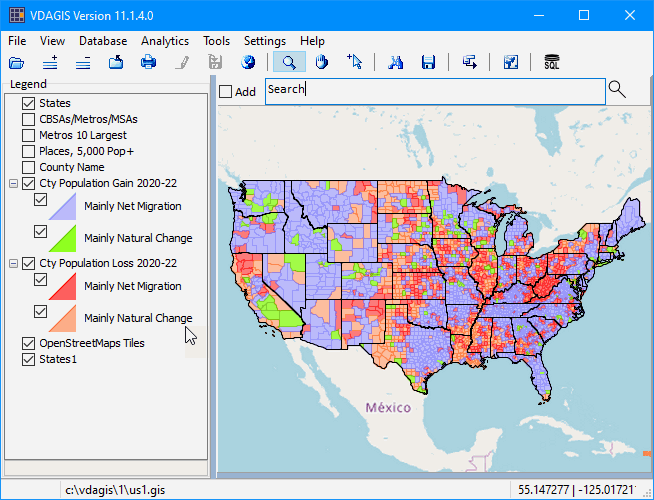 05 User Interface, Navigation, Terminology .. goto top Interpreting the GIS User Interface View In the view above, the map window shows "a thematic pattern map shows how any why county population has changed between 2020 and 2022." Five layers are checked on as shown in the legend panel at left: .. States .. Cty Population Loss 2020-2022 -- with two intervals .. Cty Population Gain 2020-2022 -- with two intervals .. OpenStreetsMaps Tiles .. States Attributes of the layer settings are managed using the Layer Editor. See more about this view and data in the CountyTrends section. Components of User Interface • Title bar and version • Main menu; below title bar • Toolbar; below main menu • Legend Panel; left • Search bar: above map window • Map Window; right; majority of screen; aligns as client • Statusbar; aligns to bottom of user interface • Table/Grid; open/close panel GIS Project and Layers VDAGIS can open a GIS project, shapefile and many other types of files. A GIS project is a file that specifies a set of layers that will be opened when used and the associated geographic file, such as a shapefile, and the initial settings when the project is opened. As the project is opened, the layers are shown in the legend panel at the left of the user interface. A layer is referred to as the active layer when it has been selected by clicking once on the layer name in the legend panel. The layer name turns blue to indicate that it has been selected. Start-Up Settings The selection of the GIS project to be used at start-up is determined by the start-up settings, also referred to as the configuration or INI file. The default setting shows the Start-up GIS project as "c:\vdagis\us1.gis". The start-up settings are managed using the Settings>SetOptions. 06 Levels and Features .. goto top VDA Desktop GIS Levels VDA Desktop GIS is designed to support users of existing GIS projects or of projects developed by the user. VDA Desktop GIS operates in the Viewer (basic, as installed) and as Level 1, 2 or 3. VDA Desktop GIS Level 1 includes all of the basic operations needed to use existing projects as well as building your own basic projects. Level 1 users can easily add wide-ranging political/statistical boundary files and integrate wide-ranging small area demographics. • Includes: - ready-to-use U.S. national scope VDA US1.GIS Project - see feature list below. • Support by Web and User Guide. VDA Desktop GIS Level 2 includes all Level 1 features and many database tools not available in Level 1. Use the database tools to manage and integrate multi-sourced data. Choose from thousands of small area demographic data and integrate into shapefiles. • Includes: - ready-to-use World by Country GIS Project. - see feature list below. • Support by Web and User Guide plus e-mail & telephone (annual). - one-to-one Webinar how-to session focused on your applications. VDA Desktop GIS Level 3 includes all Level 2 features as well as geocoding, site analysis enhanced, geoeditor and other operations not available in Level 2. • Includes: - geocoder: assign lat-lon and census block code to your address data; create your own point shapefiles. - site analysis: select custom sets of geographic points, lines or polygons; examine demographic-economic characteristics of the set. - geoeditor: create and modify point, line and polygon shapes/shapefiles. - ready-to-use U.S. national scope US3 GIS Project - ready-to-use World by Country GIS Project - see feature list below. • Support by Web and User Guide plus e-mail & telephone (annual). - up to 3 one-to-one Webinars how-to session focused on your applications. - assistance in building your GIS projects. Summary of Features by Level Feature availability: X: available, E enhanced, O: Optional VDA Desktop Toolbars 
07 Feature Descriptions .. goto top Identify Tool .. goto features .. goto top Usage: .. display a profile showing attributes of a shape for the active layer. Requirements: .. select tool is enabled .. correct active layer is selected and checked on (visible) Operation: .. click on desired shape Result: .. tabular profile is displayed in popup-form. Options: .. click multiple shapes; profiles are displayed in columns across grid. .. click export to excel button for further analysis. Example: .. view illustrates clicking first Orange County, then Los Angeles County. 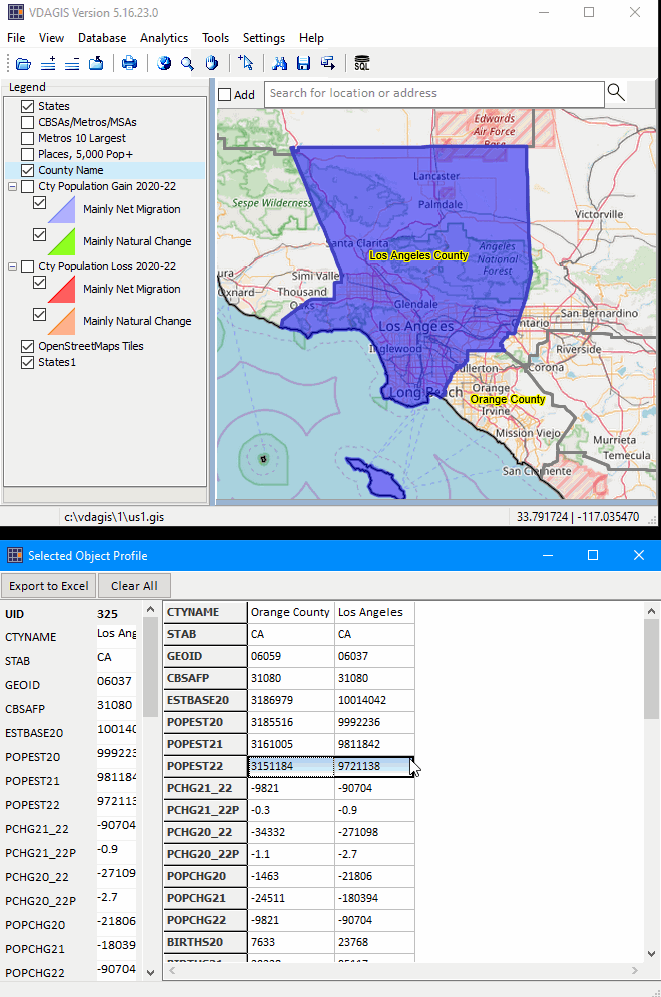 Analytics>GeoSelect/SiteAnalysis .. goto features .. goto top Usage: .. Requirements: .. Operation: .. Result: .. Options: .. GeoSelect/SiteAnalysis: 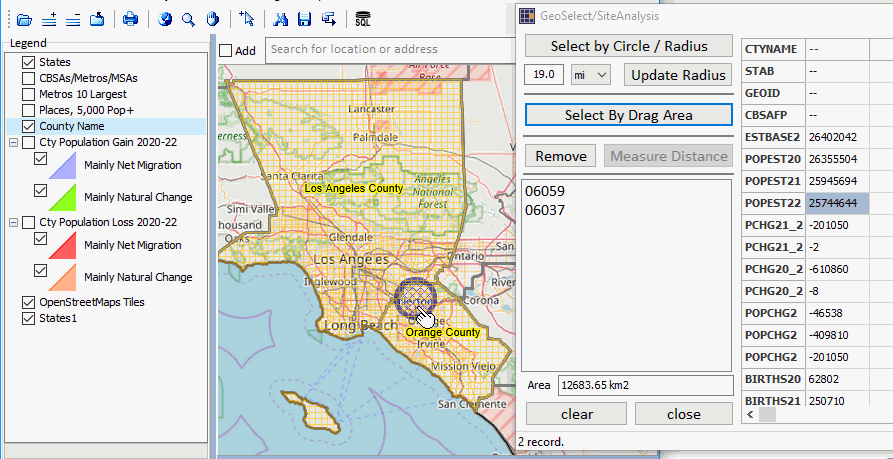 Search .. goto features .. goto top Use the Search feature above the map window to find an address or location. Key the selected location name (like Whitehouse), address, lat-lon, then press Enter. The map window zooms to that location and places a blue marker at the locatiSon. If the location is within the extent of the active layer, with select tool on, the location object highlights and a mini-profile displays. An example of using find latitude-longitude (24.6903, 46.6694 in Riyadh, Saudia Arabia) .. click link. Search/Add feature. The Search/Add feature enables the development of a shapefile as additional addresses/locations are added. For example, click the Add checkbox on (to left of Search box). To illustrate, enter 3 zip codes: 85258 Using the Search/Add feature, the GEOID (geocode field) is added as a field in the new shapefile (see above) for the active layer. As an example, if a county layer is the active layer, the county GEOID (04013 in this example) for each location. Search Feature Limitations. The Viewer version is limited to 10 searches. The Search/Add feature operates only with Level 2 or 3. File>Login .. goto features .. goto top Usage: .. Requirements: .. Operation: .. Result: .. Options: .. Login:  File>Open Server Project .. goto features .. goto top The File>Open Server Project feature is used to open a project and related project files that are located on the VDA Server. The project and files used are not located on the user local computer. But local shapefiles can be added to the server project. Only the Congressional Communities Server GIS project can be opened with the VDA GIS Viewer version. See more about the Congressional Communities GIS project. A much wider range of server projects is available to Levels 1, 2 and 3. Click File>Open Server Project then select a server project: 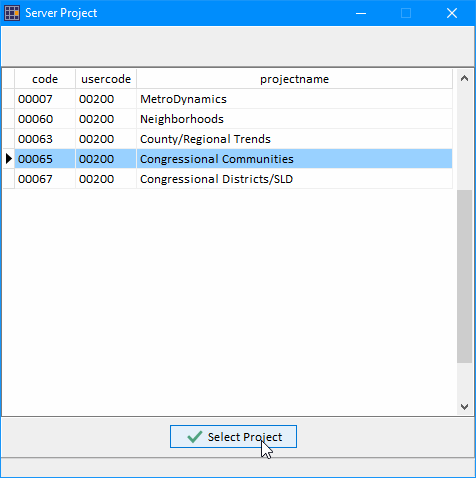 The selected project then opens: 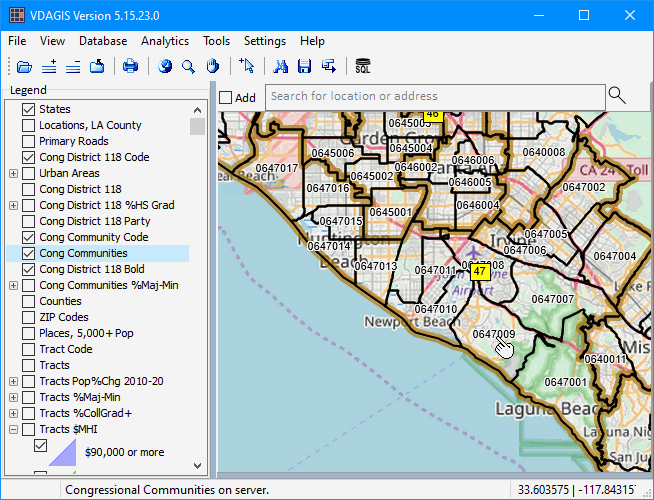 In the above view, the "Comm Communities" is made active; the user could now click on a CC shape (see pointer) with identify tool selected to show a profile for this CC. The following view illustrates adding a local computer layer to a server project: 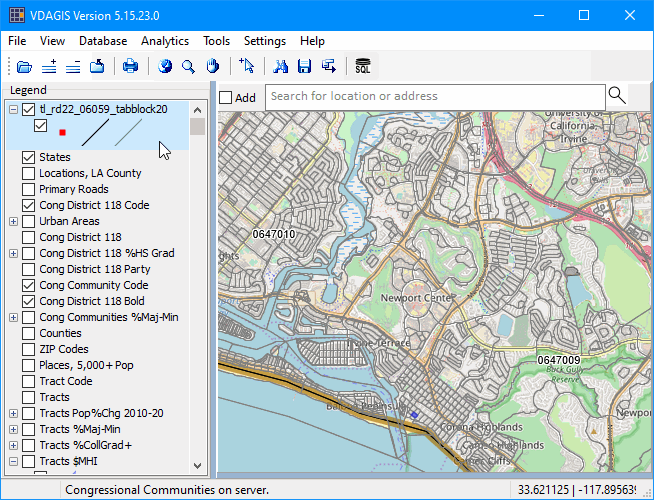 In the above view the local layer Orange County, CA Census 2020 census blocks is added to the project. The added layer shows at the top of the legend panel. The zoom-in tool is used to zoom in to view the small census blocks. File>Export .. goto features .. goto top Usage: .. used to export the active layer Requirements: .. none Operation: .. select the layer to be exported .. set query, if any .. set projection, if to be changed Result: .. current layer shapefile is exported to designated path and filename Options: .. NA Export: 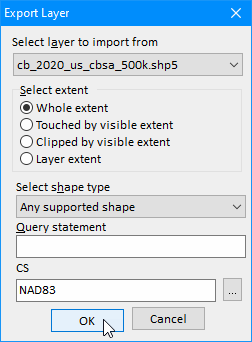 View>Layer Editor .. goto features .. goto top Usage: .. starts Layer Editor for the active layer .. Layer Editor can also be started by dbl-clicking the Legend Panel Layer Name Requirements: * .. none Operation: .. select the layer to be edited Result: .. examine or modify layer settings Options: .. NA Export: 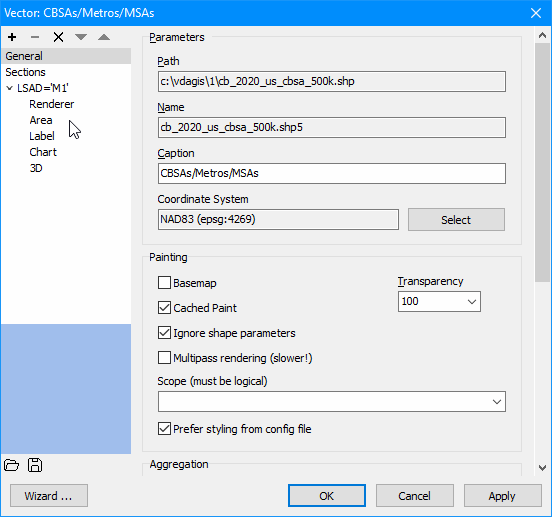 Table/Grid .. goto features .. goto top The Table/Grid feature provides a way to examine/use the subject matter items associated with the active layer. Start the Table/Grid feature by clicking the clicking the "SQL" button (rightmost on toolbar above Map window). The spreadgrid splits the map window with the table/grid shown below. The data from the active layer are shown by shape/object from the shapefile dbf. In the example with the county layer, the rows are sorted by clicking the layer header/fieldname as shown below. 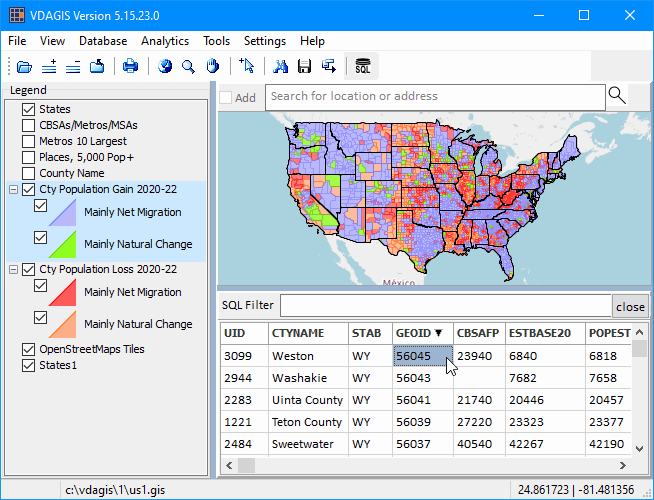 Tools>Shape Editor .. goto features .. goto top Usage: .. Add points, lines, polygons Requirements: .. Operation: .. Result: .. Options: .. Shape Editor: 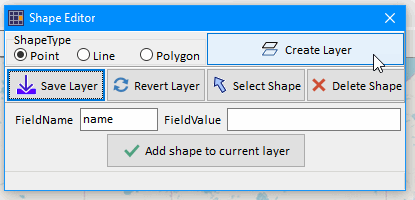 Tools>Compute Area .. goto features .. goto top Usage: .. Compute area of a shapefile, create new field, add area to new field Requirements: .. Operation: .. Result: .. Options: .. Compute Area: 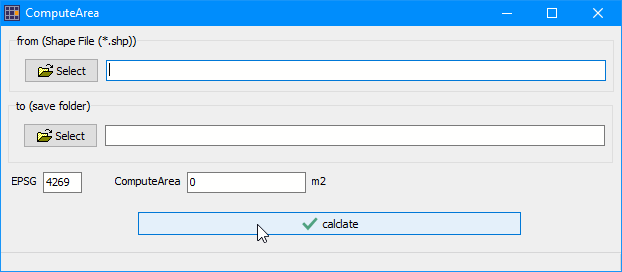 Tools>Intersect .. goto features .. goto top Usage: .. Intersect shapefile A with shapefile B Requirements: .. Operation: .. Result: .. Options: .. Intersect: 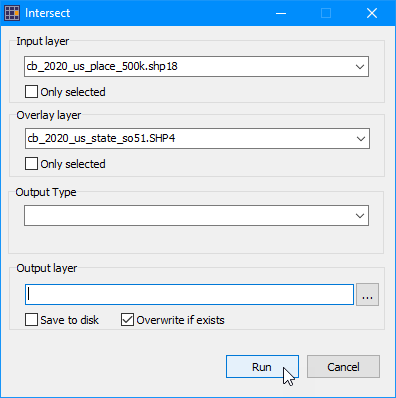 Tools>Clip .. goto features .. goto top Usage: .. Clip extent of shapefile A based on extent of shapefile B Requirements: .. Operation: .. Result: .. Options: .. Clip: 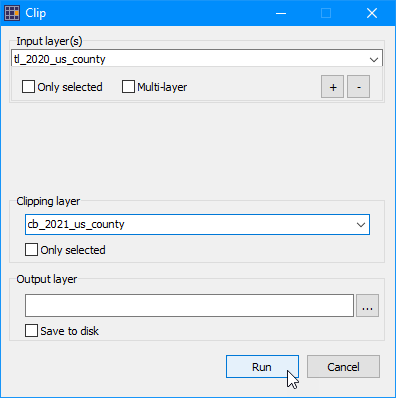 Tools>Merge .. goto features .. goto top Usage: .. Merge multiple shapefiles into one new shapefile based on common field Requirements: .. Operation: .. Result: .. Options: .. Merge:  Tools>Dissolve .. goto features .. goto top Usage: .. Requirements: .. Operation: .. Result: .. Options: .. Dissolve: 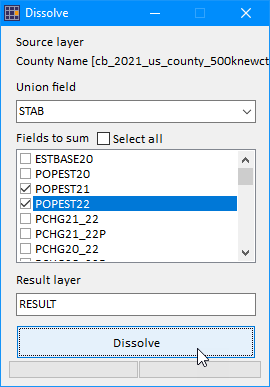 Settings>SetOptions.. goto features .. goto top Usage: The VDAGIS start-up settings are managed by the configuration (INI) file. Examine or modify the configuration file using Settings>SetOptions from the main menu. Requirements: .. Operation: .. Result: .. Options: .. Configuration Settings: 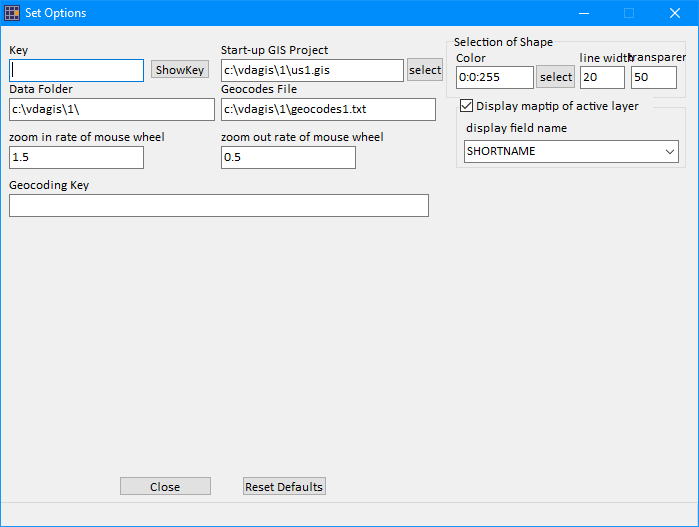 Layer Editor.. goto features .. goto top The Layer Editor is used to modify the appearance of a layer in the map window. The Layer Editor operates on a layer shown in the Legend Panel. Start the Layer Editor by dbl-clicking on the name of the layer in the Legend Panel. Data Resources .. goto top Integrating DEDE Output with VDA GIS .. goto top Terms of Use .. goto top Frequently Asked Questions .. goto top Support Using these Resources .. goto top Learn more about demographic economic data and related analytical tools. Join us in a Decision-Making Information Web session. There is no fee for these one-hour Web sessions. Each informal session is focused on a specific topic. The open structure also provides for Q&A and discussion of application issues of interest to participants. ProximityOne User Group Join the ProximityOne User Group to keep up-to-date with new developments relating to geographic-demographic-economic decision-making information resources. Receive updates and access to tools and resources available only to members. Use this form to join the User Group. There is no fee. Additional Information ProximityOne develops geographic-demographic-economic data and analytical tools and helps organizations knit together and use diverse data in a decision-making and analytical framework. We develop custom demographic/economic estimates and projections, develop geographic and geocoded address files, and assist with impact and geospatial analyses. Wide-ranging organizations use our tools (software, data, methodologies) to analyze their own data integrated with other data. Follow ProximityOne on Twitter at www.twitter.com/proximityone. Contact ProximityOne (888-364-7656) with questions about data covered in this section or to discuss custom estimates, projections or analyses for your areas of interest. |
|
|