
|
|
|
State Trends CVXE GIS Tools Data Resources Guide - projections to 2060 Related Sections - Situation & Outlook - Applications Gallery - States - Congressional District - School Districts - Counties - Cities/Places - Tracts/Neighborhoods - Block Groups - Census Blocks - Urban Areas Estimates-Projections - 2060 Demographic ... all county interactive table - 2030 Demographic-Economic - Single Year of Age GIS Thematic Mapping Visual Analysis Tools Ranking Tables National Scope Demographic Change 2000-2010 - States - Metros - Congressional District - School Districts - Counties - Cities/Places - Census Tracts |
State Population Estimates & Components of Change -- analyzing patterns 2010-2014
State population dynamics are changing. Learn more about how states are changing and why using tools and resources reviewed here. Based on the new 2014 population estimates and components of change (December 2014), the population percent natural increase ranged from -0.69% (West Virginia) to 12.4% (Utah) during the period 7/1/2013 to 6/30/2014. This is one example of insights into the components of population change that can be determined using the interactive table in this section. Use the table to view, compare, rank state population estimates and components of change (births, deaths, migration). More about these estimates. State population and components of change data are part of the Situation & Outlook (S&O) database and information system. Access/analyze these data in context of related geographic, demographic, economic and business data. Visual Analysis of Migration Patterns, 2011-2014 The map graphic below shows patterns of total cumulative state net migration for the years 2011-2014 (7/1/10 to 7/1/14). See inset legend. The label shows total state net migration for the period as a percent of 2014 total population. In expanded view, the top label shows the total state net migration for the period and the bottom label shows total state net migration for the period as a percent of 2014 total population. Use the GIS project (details below) to create views with other population and population components of change or rates for any year or year group. Label areas as desired. Add other layers such as regions or divisions. Add your own data. See about related state-to-state migration patterns. State Migration Patterns, 2011-2014 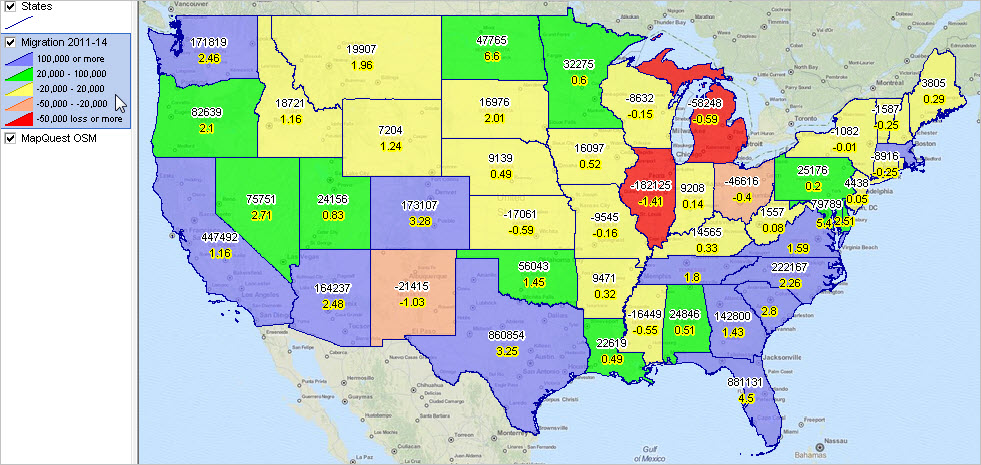 View created with CV XE GIS. Click graphic for larger view with more detail. 10 Most Populous States on 7/1/14
10 Fastest-Growing States: 7/1/13 - 7/1/14
10 States with Largest Population Increase: 7/1/13 - 7/1/14
State/Region/U.S. Population & Components of Change; 2010-2014 -- Interactive Table Click column header to sort; click again to sort other direction. Model-based estimates. See usage notes below table. See related Ranking Tables Main Page Click row to copy to clipboard Usage Notes • Use buttons below table for column group selections. Population & Components of Change Items The scroll box shown below lists each of the subject matter items available for each area via the interactive table. The subject matter item name shown at the left and is also used as the short name for the subject matter item in the column header in the ranking table. The item name is also used as the field name in GIS applications.
Creating Map Pattern Views & Visual Analysis (requires Windows computer with Internet connection) 1. Install the ProximityOne CV XE GIS ... run the CV XE GIS installer ... take all defaults during installation 2. Download the U.S. by State Population 2014 GIS project fileset ... requires ProximityOne User Group ID (join now, no fee) ... unzip U.S. State Population GIS project files to local folder c:\popest 3. Open the c:\popest\stpop2014.gis project ... after completing the above steps, click File>Open>Dialog ... open the file named c:\popest\stpop2014.gis 4. Done. The start-up view is similar to the graphic shown at the top of this section. About the Estimates Annual U.S. and state level population estimates and components of change are released in January of each year and provide estimates as of July 1 in the previous year. These estimates are subsequently used by the Census Bureau as "control totals" to develop national scope county level estimates for the same date later in the year. In January 2014, the state level estimates and components of change data were released for the most recent estimate of total resident population as of July 1, 2013, and so on in successive years. These model-based estimates are important because they reflect the Census Bureau's best estimate of the actual population in these areas. They are also important because the estimates become an annual time series that can be used in yet other modeling, estimation and projection applications. As of now, post Census 2010 estimates are available annually for 2010 through 2014. These data are also important because they are the "control total" estimates for county and other sub-state estimates developed by the Census Bureau that become the basis for Federal funding and other resource allocation formulas. The components of change data are equally important as they are mathematically connected to the derivation of the total population estimates. The population identity is used to the develop the total population estimates: P(2014) = P(2013) + B(2013) - D(2013) + IM(2013) +DM(2013) where P is total population and B(births), D(deaths), IM(net international migration) and DM(net domestic migration) are the components of change. Components of change provide insights into why one the population in one state grows at a different rate compared to other states. Support Using these Resources Learn more about demographic economic data and related analytical tools. Join us in a Decision-Making Information Web session. There is no fee for these one-hour Web sessions. Each informal session is focused on a specific topic. The open structure also provides for Q&A and discussion of application issues of interest to participants. ProximityOne User Group Join the ProximityOne User Group to keep up-to-date with new developments relating to geographic-demographic-economic decision-making information resources. Receive updates and access to tools and resources available only to members. Use this form to join the User Group. There is no fee. Additional Information ProximityOne develops geographic-demographic-economic data and analytical tools and helps organizations knit together and use diverse data in a decision-making and analytical framework. We develop custom demographic/economic estimates and projections, develop geographic and geocoded address files, and assist with impact and geospatial analyses. Wide-ranging organizations use our tools (software, data, methodologies) to analyze their own data integrated with other data. Follow ProximityOne on Twitter at www.twitter.com/proximityone. Contact ProximityOne (888-364-7656) with questions about data covered in this section or to discuss custom estimates, projections or analyses for your areas of interest. |
|
|