
|
|
|
State Trends CVXE GIS Tools Data Resources Guide - projections to 2060 Related Sections - Situation & Outlook - Applications Gallery - States - Congressional District - School Districts - Counties - Cities/Places - Tracts/Neighborhoods - Block Groups - Census Blocks - Urban Areas Estimates-Projections - 2060 Demographic ... all county interactive table - 2030 Demographic-Economic - Single Year of Age GIS Thematic Mapping Visual Analysis Tools Ranking Tables National Scope Demographic Change 2000-2010 - States - Metros - Congressional District - School Districts - Counties - Cities/Places - Census Tracts |
State-to-State Geographic Mobility: Migration Flows in 2013
In 2013, there were an estimated 548,034 people who moved from a residence 1 year earlier, in a different state, to Texas. Texas experienced the largest number of movers (inflows) from other states among all states. 66,318 of these movers were from California. See the interactive table in this section to examine similar characteristics for any state. These data are based on the 2013 American Community Survey. See related data. Migration data described in this section are part of the Situation & Outlook (S&O) database and information system. Access/analyze these data in context of related geographic, demographic, economic and business data. Visual Analysis of Mobility Patterns The following view shows patterns of New York state outmigration by destination state. See inset legend. Note the legend shows only those states that account for 2% or more of New York out migration. Florida is the largest New York 2013 out migration destination state with 55,419 movers from New York to Florida. Intervals/colors could be changed to any configuration. The label shows total New York state out migration for that state. Expanded view shows detail more clearly. See this related view that shows a zoom-in to east coast area. Use the GIS project (details below) to create similar views for any state; visual analysis of outmigration for any state showing outmigration by destination state. Label areas as desired. Add other layers. Add your own data. New York State OutMigration by Destination State 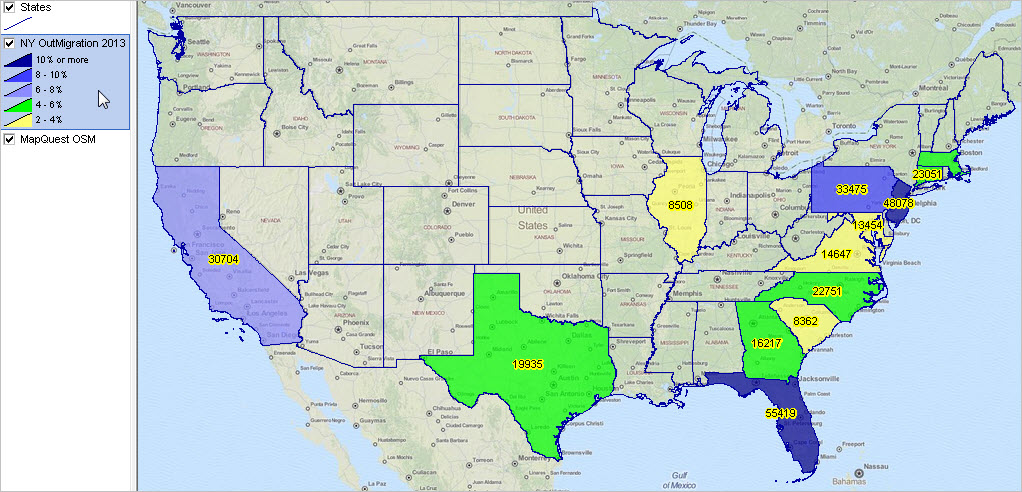 View created with CV XE GIS. Click graphic for larger view with more detail. The American Community Survey (ACS) asks respondents age 1 year and over whether they lived in the same residence 1 year ago. For people who lived in a different residence, the location of their previous residence is collected. The state-to-state migration flows are created from tabulations of the current state (including the District of Columbia) of residence crossed by state of residence 1 year ago. Use the interactive ranking table ranking table provided below to rank states based on the number of movers between states. These data are based on the 2013 ACS 1 year estimates. The data reflect movers during calendar year 2013. These data are estimates; smaller estimates are subject to a relatively high margin of error. Movers Within and Between States & Selected Areas During 2013 Click column header to sort; again to sort other direction. Usage notes below table. See related Ranking Tables Main Page Using the Table The rows in each table represent the state of current residence. • Pop 1yr+ 1 Year Ago -- the population age 1 year and over. • Non Movers -- population that did not change residence in the past year. • Movers within state -- population that moved during past year within same state • Movers from different state -- total movers into this state from a different state in past year. State columns (columns 6 to end) represent the state of residence 1 year ago. The cells where the current residence and residence 1 year ago are in the same state are the estimated number of people who moved within the state. To view the number of movers in California from 1 year ago (column) to the current state of residence (row), click the CA column header for an ascending ranked view, and click that column header again for a descending ranked view. Creating Map Pattern Views & Visual Analysis (requires Windows computer with Internet connection) 1. Install the ProximityOne CV XE GIS ... run the CV XE GIS installer ... take all defaults during installation 2. Download the U.S. by State Migration 2013 GIS project fileset ... requires ProximityOne User Group ID (join now, no fee) ... unzip U.S. State Migration GIS project files to local folder c:\migration 3. Open the c:\migration\stmig2013.gis project ... after completing the above steps, click File>Open>Dialog ... open the file named c:\migration\stmig2013.gis 4. Done. The start-up view is similar to the graphic shown at the top of this section. Related Data • State Population & Components of Change 2010-2014 -- includes annual births, deaths, domestic and net migration estimates and rates • State of the States 2013 • Accessing ACS 2013 1 Year State Estimates Support Using these Resources Learn more about demographic economic data and related analytical tools. Join us in a Decision-Making Information Web session. There is no fee for these one-hour Web sessions. Each informal session is focused on a specific topic. The open structure also provides for Q&A and discussion of application issues of interest to participants. ProximityOne User Group Join the ProximityOne User Group to keep up-to-date with new developments relating to geographic-demographic-economic decision-making information resources. Receive updates and access to tools and resources available only to members. Use this form to join the User Group. There is no fee. Additional Information ProximityOne develops geographic-demographic-economic data and analytical tools and helps organizations knit together and use diverse data in a decision-making and analytical framework. We develop custom demographic/economic estimates and projections, develop geographic and geocoded address files, and assist with impact and geospatial analyses. Wide-ranging organizations use our tools (software, data, methodologies) to analyze their own data integrated with other data. Follow ProximityOne on Twitter at www.twitter.com/proximityone. Contact ProximityOne (888-364-7656) with questions about data covered in this section or to discuss custom estimates, projections or analyses for your areas of interest. |
|
|