North Dakota

Contents
Selected CV XE GIS project/application views in North Dakota.
Click toggle in Table of Contents at left to view different geography/applications.
Join in the conversation (click to follow):
| • | accessing, integrating & using geographic, demographic, economic data |
| • | decision-making information resources & solutions. |
This section is focused on integrating S&O digital map files, Census 2010 demographics, ACS demographics and related data.
See related interactive ranking tables:
| • | North Dakota regional section: http://proximityone.com/srdmi/nddmi.htm |
| • | North Dakota school district profiles: http://proximityone.com/nd_sdc.htm |
See related interactive ranking tables:
| • | North Dakota school district demographics: http://proximityone.com/sd_nd.htm |
| • | North Dakota census tract demographics: http://proximityone.com/ustr0509_nd.htm |
| • | Census 2010 demographics: http://proximityone.com/cen2010_pl94171.htm |
(all US geography: state, congressional district, county, school district, city/place, metro)
Situation & Outlook Narrative Demographic-Economic Profiles (updated monthly)
-- http://proximityone.com/s&o_narrative_profiles.htm
Situation & Outlook Interactive Comparative Analysis Profiles
-- http://proximityone.com/s&o_comparative_profiles.htm
The table presented below provides a summary demographic profile for the state based on the Census 2010 P.L. 94-171 data. Similar to a profile developed by Census, this profile also includes two columns providing characteristics for the population under 18 years of age. These profiles are available for any Census 2010 geography, census block and higher level geography.
ProximityOne -- additional details and interactive ranking table
|
||||||||||||||||||||||||||||||||||||||||||||||||||||||||||||||||||||||||||||||||||||||||||||||||||||||||||||||||||||||||||||||||||||||||||||||||||||||||||||||||||||||||||||||||||||||||||||||||||||||||||
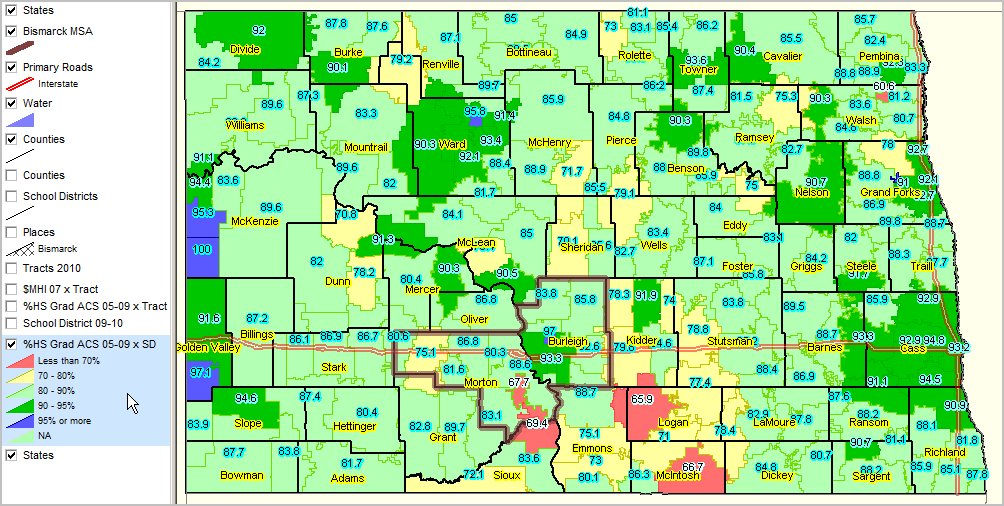
Educational Attainment by School District
Percent high school graduate (population 25 years and over) by school district.
Data based on 2009 American Community Survey (http://proximityone.com/acs.htm) 5-year estimates, centric to mid-2007.
View 1 (see View 2 with counties below View1)
Bismarck MSA shown with bold boundary.
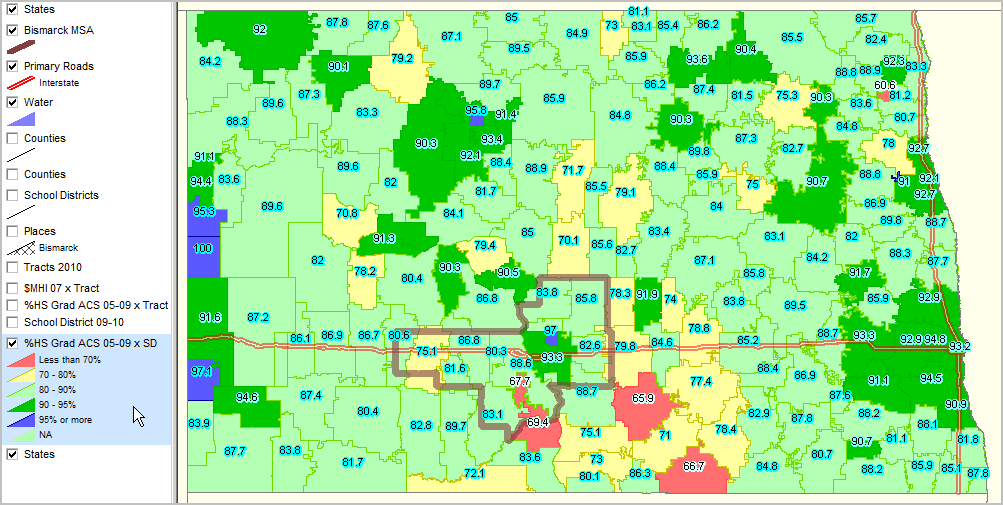
View 2, similar to View 1, with county names