Iowa

Contents
Selected CV XE GIS project/application views in Iowa.
Click toggle in Table of Contents at left to view sub-state applications.
Integrating Census 2010 TIGER Shapefiles, ACS 5-year demographics and related data.
See related interactive ranking tables:
| • | Iowa school district demographics: http://proximityone.com/sd_ia.htm. |
| • | Iowa census tract demographics: http://proximityone.com/ustr0509_ia.htm. |
| • | Census 2010 demographics: http://proximityone.com/cen2010_pl94171.htm |
(all US geography: state, congressional district, county, school district, city/place, metro)
The table presented below provides a summary demographic profile for the state based on the Census 2010 P.L. 94-171 data. Similar to a profile developed by Census, this profile also includes two columns providing characteristics for the population under 18 years of age. These profiles are available for any Census 2010 geography, census block and higher level geography.
ProximityOne -- additional details and interactive ranking table
|
||||||||||||||||||||||||||||||||||||||||||||||||||||||||||||||||||||||||||||||||||||||||||||||||||||||||||||||||||||||||||||||||||||||||||||||||||||||||||||||||||||||||||||||||||||||||||||||||||||||||||
Navigate to sub-state areas: click on expanding text menu in left panel to view available sections.
National to Intersection Level Multicultural Analysis Using Census 2010+
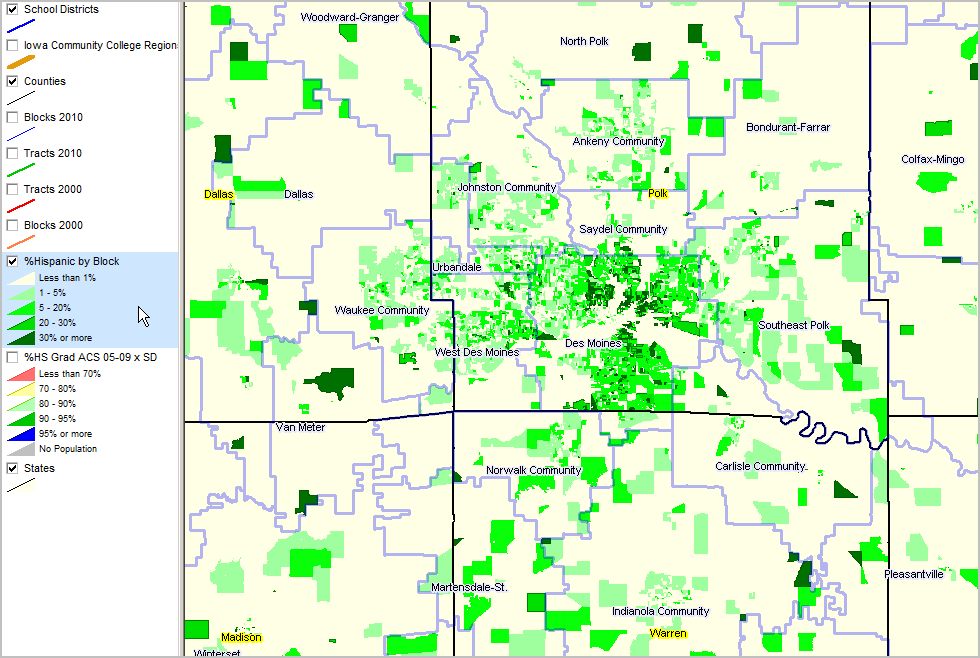
Percent Hispanic Population data from Census 2010 P.L. 94-171. Hispanic population used to illustrate, select from 70+ multicultural race/ethnic combinations. See http://proximityone.com/cen2010_pl94171.htm for additional information and related ranking table. See color pattern and data intervals in highlighted layer in legend at left of map.
|
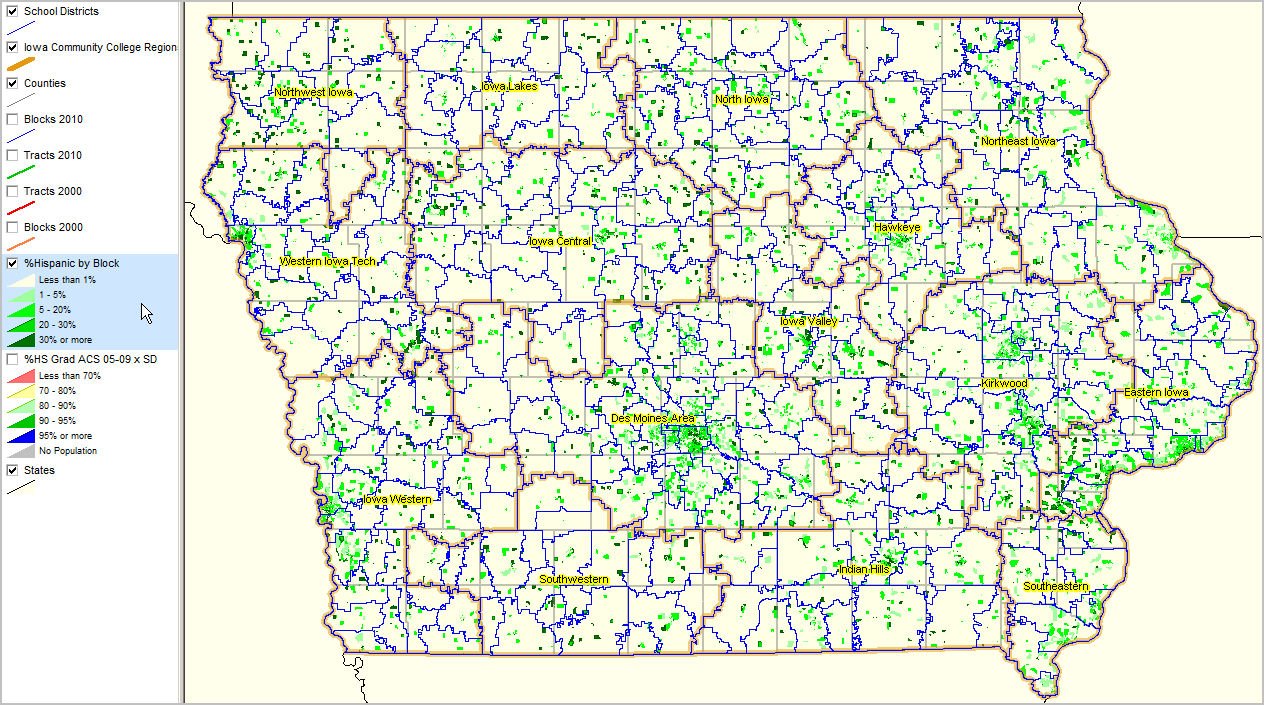
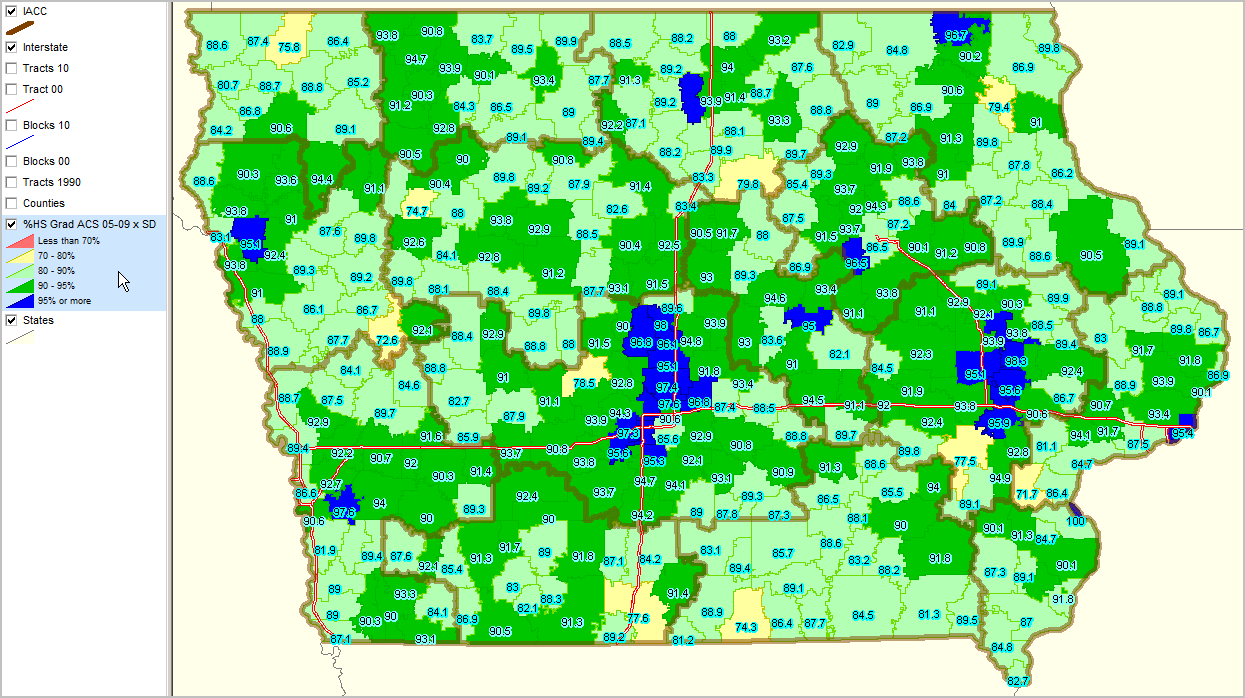
Patterns of Educational Attainment & Economic Prosperity by School District & Census Tract
Educational Attainment by School District Percent high school graduate (population 25 years and over) by school district. Data based on 2009 American Community Survey (http://proximityone.com/acs.htm) 5-year estimates, centric to mid-2007.
|
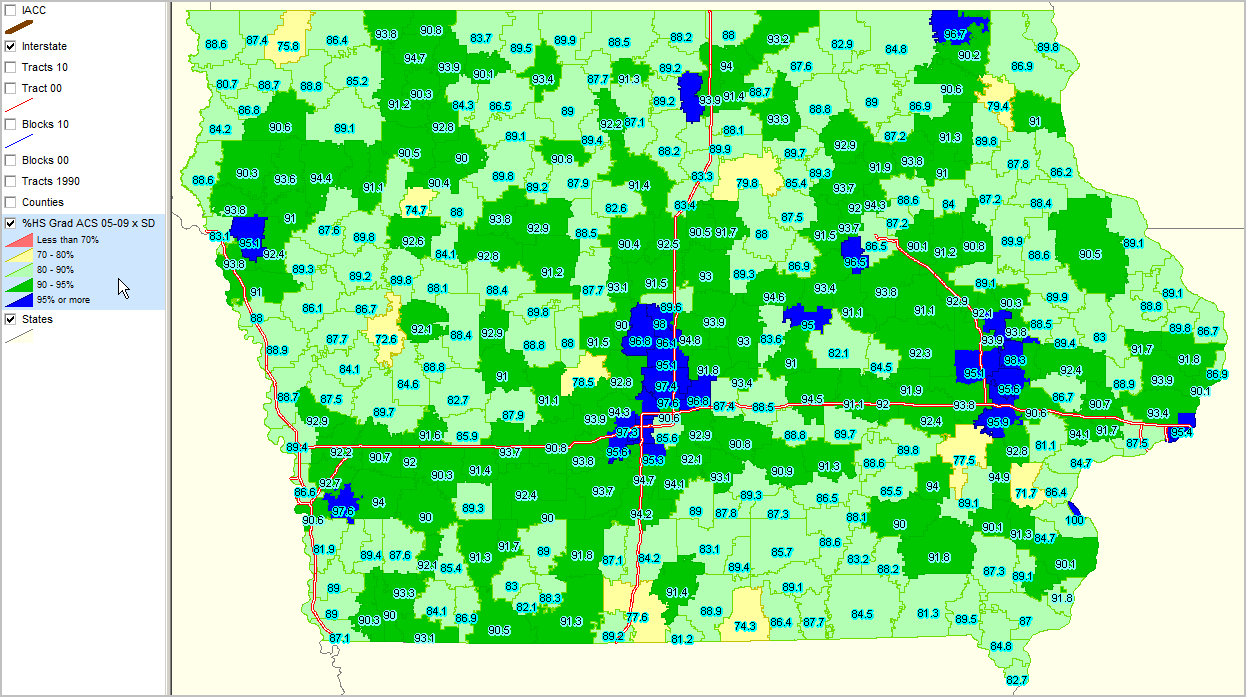
Educational Attainment by School District Percent high school graduate (population 25 years and over) by school district. Data based on 2009 American Community Survey (http://proximityone.com/acs.htm) 5-year estimates, centric to mid-2007.
Similar view to above with Iowa Community College regions
|