
|
|
|
State Trends CVXE GIS Tools Data Resources Guide - projections to 2060 Related Sections - Situation & Outlook - Applications Gallery - States - Congressional District - School Districts - Counties - Cities/Places - Tracts/Neighborhoods - Block Groups - Census Blocks - Urban Areas Estimates-Projections - 2060 Demographic ... all county interactive table - 2030 Demographic-Economic - Single Year of Age GIS Thematic Mapping Visual Analysis Tools Ranking Tables National Scope Demographic Change 2000-2010 - States - Metros - Congressional District - School Districts - Counties - Cities/Places - Census Tracts |
State Median Household Income & Patterns of Income Inequality
The growth of income inequality has been widely reported. The recent New York Times story summarizes growth of the wealth gap and income inequality. The Pew Research Center report finds that in 2013, the wealth gap between upper-income and middle-income families was larger than at any point in the last 30 years for which we have data. There are many ways to measure how income inequality is growing. This section uses data from the American Community Survey (ACS). Appealing reasons for using the ACS data include the availability of the same subject matter reviewed here for states is also available down to the census tract and block group geographic levels. The ACS data also provide many related subject matter items, such as educational attainment, that are relevant to extended analyses. Use the interactive table below to view, rank, and compare national and state level median household income based on the 2012 ACS and 2013 ACS. Interactively examine how the Gini Index, a measure of income inequality, varies by state. These data are from the ACS 1-year estimates and compare respondent data for calendar year 2012 data with calendar year 2013. Estimates from the 2013 ACS compared to the 2012 ACS estimates show a significant increase in median household income at the national level and for many states. Visual Analysis of State Patterns of Income Inequality The following graphic shows state patterns of income inequality based on the 2013 Gini Index. See more about the Gini Index below and examine patterns using the interactive table below. 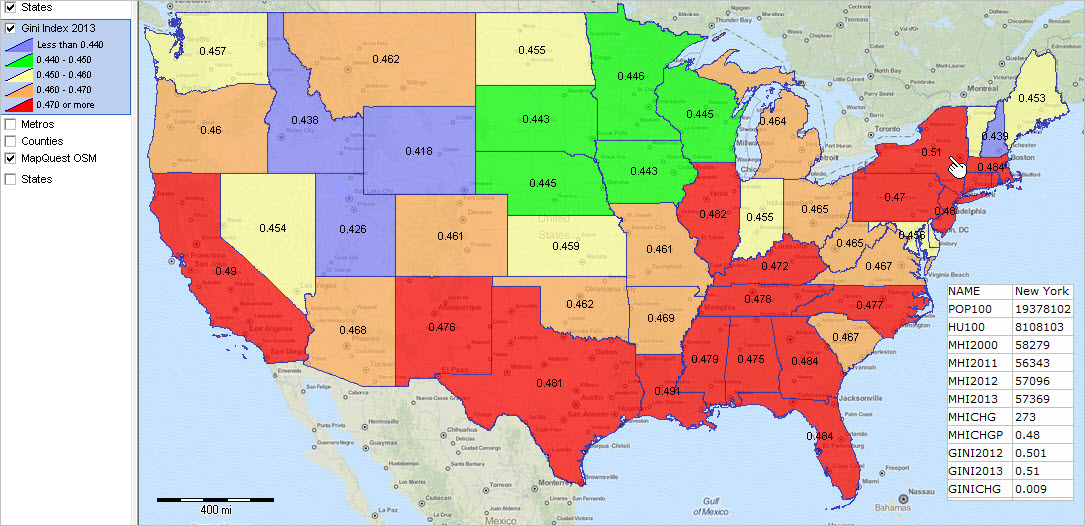 View created with CV XE GIS. Click graphic for larger view. Use the MHI/Gini Index GIS project for further analysis and alternative map views; see details below. Median Household Income An analysis by the Census Bureau indicates that real median household income in the U.S experienced a statistically significant increase between the 2012 ACS and the 2013 ACS. The 2012 U.S. median household income was $51,915, and the 2013 U.S. median household income was $52,250. Use the interactive table to examine patterns median household income among states. Income Inequality The Gini Index is a summary measure of income inequality. The Gini Index varies from 0 to 1, with a value of 0 indicating perfect equality, where there is a proportional distribution of income across all households. A value of 1 indicates perfect inequality, where one household has all the income and all others have no income. The Gini Index for the U.S. in the 2013 ACS (0.481) was significantly higher than in the 2012 ACS (0.476). This increase suggests that income inequality increased nationally. The Gini Index for the 2013 ACS increased in 15 states. Examine patterns of income inequality using the interactive table below. Median Household Income & Gini Index, 2012, 2013 & Change Click a column header to sort; click again to sort in the other direction. See related Ranking Tables Main Page Use the State MHI/Gini GIS Project for Further Analysis 1. Install the ProximityOne CV XE GIS (only required if not already installed) ... run the CV XE GIS installer ... take all defaults during installation 2. Download the U.S. by State MHI/Gini GIS project fileset ... requires ProximityOne User Group ID (join now) ... unzip U.S. State MHI/Gini GIS project files to local folder c:\statemhi2013 3. Open the c:\statemhi2013\statemhi2013.gis project ... after completing the above steps, click File>Open>Dialog ... open the file named c:\statemhi2013\statemhi2013.gis 4. Done. Start-up view appears similar to map graphic shown at the top of this section. How State Patterns are Changing -- Related Data • State Population & Components of Change 2010-2014 -- includes annual births, deaths, domestic and net migration estimates and rates • State Migration; Patterns of State-to-State Mobility • State of the States 2013 • Accessing ACS 2013 1 Year State Estimates ProximityOne User Group Join the ProximityOne User Group to keep up-to-date with new developments relating to metros and component geography decision-making information resources. Receive updates and access to tools and resources available only to members. Use this form to join the User Group. Support Using these Resources Learn more about accessing and using demographic-economic data and related analytical tools. Join us in a Data Analytics Lab session. There is no fee for these one-hour Web sessions. Each informal session is focused on a specific topic. The open structure also provides for Q&A and discussion of application issues of interest to participants. Additional Information ProximityOne develops geodemographic-economic data and analytical tools and helps organizations knit together and use diverse data in a decision-making and analytical framework. We develop custom demographic/economic estimates and projections, develop geographic and geocoded address files, and assist with impact and geospatial analyses. Wide-ranging organizations use our tools (software, data, methodologies) to analyze their own data integrated with other data. Follow ProximityOne on Twitter at www.twitter.com/proximityone. Contact us (888-364-7656) with questions about data covered in this section or to discuss custom estimates, projections or analyses for your areas of interest. |
|
|