CV XE GIS Home Page


  ProximityOne Main

  State Trends Main

  New Topics & Updates

  Products & Services

  S&O Metro Reports

  Situation & Outlook

  Related Sections
  - Applications Gallery
  - States
  - School Districts
  - Metros
  - Congressional
  - Counties
  - Census Tracts
  - Block Groups
  - Census Blocks
  - ZIP Codes
  - Urban Areas

  Estimates-Projections
  - County Interactive
  - 5-year Projections
  - Quarterly Projections
  - 2030 Projections
  - 2060 Projections

  CV XE GIS
    Visual Analysis

  Interactive Tables

  National Scope
  Demographic Change
  2000-2010
  - States
  - Metros
  - Congressional Dist
  - School Districts
  - Counties
  - Cities/Places
  - Census Tracts


State Population & Components of Change: 2010-2017
Decision-Making Information
  ProximityOne
  information resources & solutions
  (888) DMI-SOLN
  (888) 364-7656


Put data to work more effectively.
Certificate in Data Analytics


Visual analysis with ProximityOne tools
click graphic for info; hover to pause

 
visually analyze clients/markets
site analysis using 1 mile radius

S1

$median household income
patterns by census tract - Houston

hover to pause

113th Congressional Districts

Click for info

US Asian Indian population 2010

Click for 
info

geocoded students and school
McKinney ISD, TX

Click for 
info

geocoded students and school
with tax parcels & streets

Click for 
info

high school attendance zones
with schools by type

Click for 
info

%high school graduates by
census tract - Puerto Rico

Click for info

Austin, TX MSA counties &
places 10K+ population markers

Click for info

Appalachia counties (green) &
coalfield counties (orange)

Click for info

China provinces percent urban &
cities (markers) by state plan

Click for info

Honolulu census tracts (red)
& census blocks


Central Park area NYC

Click for info

Kansas City Metro & Counties
Home Depot locations (markers)

Click for info

World Cities; focus on Spain

Click for info


Data Analytics Blog
Power of Combining Maps with Data

Support & Technical Assistance
help using these resources


December 2017 .. examining how state demographics are changing 2010-2017 ... using the new 2017 population and components of changes estimates. The U.S. population changed from 308,758,105 (2010) to 325,719,178 (2017), a change of 16,380,757 (5.3%). See details for the U.S. and each state in the interactive table below.

This section provides access to tools to view and analyze annual population estimates, 2010 to 2017, rankings and components of change for the U.S., regions and states. Use the interactive table below in this section to view, rank, compare these data. Use the GIS tools and ready-to use project described below in this section to create maps for states and regions of interest. Create thematic maps for any of the fields/measures shown in the interactive table. Change color patterns and labels. Integrate your own data. See more about these data

Patterns of Population Change by State, 2010-2017
The following graphic shows patterns of percent population change from 2010 to 2017. Use the associated GIS project to examine different years or subject matter items. Click graphic for larger view; expand browser window for best quality view.
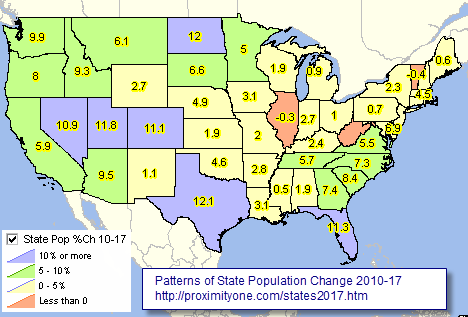
.. view developed with ProximityOne CV XE GIS and related GIS project.
.. larger view illustrates partial mini-profile/table for Texas demographic items.
.. create other views, geospatial analysis, integrate other data using the State 2010-17 Trends GIS project

State Population & Components of Change 2010-2017 interactive table
  Click column header to sort; again to sort other direction.
  Click ShowAll button between queries to refresh. Usage notes below table.
  See related Interactive Tables Main Page


Usage Notes
  • Click ShowAll between queries/filters.
  • PopCols button
    .. click button to view Population 2010-17 columns.

Items in Table
#   FieldNameDescription
0   NAMEState name
1   STUSPS abbreviation
2   SUMLEVGeographic summary level
3   REGIONCensus Region code
4   DIVISIONCensus Division code
5   STFIPSState FIPS code
6   CEN2010POP4/1/2010 resident total Census 2010 population
7   BAS2010EST4/1/2010 resident total population estimates base
8   P20107/1/2010 resident total population estimate
9   P20117/1/2011 resident total population estimate
10   P20127/1/2012 resident total population estimate
11   P20137/1/2013 resident total population estimate
12   P20147/1/2014 resident total population estimate
13   P20157/1/2015 resident total population estimate
14   P20167/1/2016 resident total population estimate
15   P20177/1/2017 resident total population estimate
16   P1617Change 16-17
17   PCT1617%Change 16-17
18   P1017Change 10-17
19   PCT1017%Change 10-17
20   NCHG_2010Numeric change in resident total population 4/1/2010 to 7/1/2010
21   NCHG_2011Numeric change in resident total population 7/1/2010 to 7/1/2011
22   NCHG_2012Numeric change in resident total population 7/1/2011 to 7/1/2012
23   NCHG_2013Numeric change in resident total population 7/1/2012 to 7/1/2013
24   NCHG_2014Numeric change in resident total population 7/1/2013 to 7/1/2014
25   NCHG_2015Numeric change in resident total population 7/1/2014 to 7/1/2015
26   NCHG_2016Numeric change in resident total population 7/1/2015 to 7/1/2016
27   NCHG_2017Numeric change in resident total population 7/1/2016 to 7/1/2017
28   B2010Births in period 4/1/2010 to 6/30/2010
29   B2011Births in period 7/1/2010 to 6/30/2011
30   B2012Births in period 7/1/2011 to 6/30/2012
31   B2013Births in period 7/1/2012 to 6/30/2013
32   B2014Births in period 7/1/2013 to 6/30/2014
33   B2015Births in period 7/1/2014 to 6/30/2015
34   B2016Births in period 7/1/2015 to 6/30/2016
35   B2017Births in period 7/1/2016 to 6/30/2017
36   D2010Deaths in period 4/1/2010 to 6/30/2010
37   D2011Deaths in period 7/1/2010 to 6/30/2011
38   D2012Deaths in period 7/1/2011 to 6/30/2012
39   D2013Deaths in period 7/1/2012 to 6/30/2013
40   D2014Deaths in period 7/1/2013 to 6/30/2014
41   D2015Deaths in period 7/1/2014 to 6/30/2015
42   D2016Deaths in period 7/1/2015 to 6/30/2016
43   D2017Deaths in period 7/1/2016 to 6/30/2017
44   NINC2010Natural increase in period 4/1/2010 to 6/30/2010
45   NINC2011Natural increase in period 7/1/2010 to 6/30/2011
46   NINC2012Natural increase in period 7/1/2011 to 6/30/2012
47   NINC2013Natural increase in period 7/1/2012 to 6/30/2013
48   NINC2014Natural increase in period 7/1/2013 to 6/30/2014
49   NINC2015Natural increase in period 7/1/2014 to 6/30/2015
50   NINC2016Natural increase in period 7/1/2015 to 6/30/2016
51   NINC2017Natural increase in period 7/1/2016 to 6/30/2017
52   INTMIG2010Net international migration in period 4/1/2010 to 6/30/2010
53   INTMIG2011Net international migration in period 7/1/2010 to 6/30/2011
54   INTMIG2012Net international migration in period 7/1/2011 to 6/30/2012
55   INTMIG2013Net international migration in period 7/1/2012 to 6/30/2013
56   INTMIG2014Net international migration in period 7/1/2013 to 6/30/2014
57   INTMIG2015Net international migration in period 7/1/2014 to 6/30/2015
58   INTMIG2016Net international migration in period 7/1/2015 to 6/30/2016
59   INTMIG2017Net international migration in period 7/1/2016 to 6/30/2017
60   DOMMIG2010Net domestic migration in period 4/1/2010 to 6/30/2010
61   DOMMIG2011Net domestic migration in period 7/1/2010 to 6/30/2011
62   DOMMIG2012Net domestic migration in period 7/1/2011 to 6/30/2012
63   DOMMIG2013Net domestic migration in period 7/1/2012 to 6/30/2013
64   DOMMIG2014Net domestic migration in period 7/1/2013 to 6/30/2014
65   DOMMIG2015Net domestic migration in period 7/1/2014 to 6/30/2015
66   DOMMIG2016Net domestic migration in period 7/1/2015 to 6/30/2016
67   DOMMIG2017Net domestic migration in period 7/1/2016 to 6/30/2017
68   NETMIG2010Net migration in period 4/1/2010 to 6/30/2010
69   NETMIG2011Net migration in period 7/1/2010 to 6/30/2011
70   NETMIG2012Net migration in period 7/1/2011 to 6/30/2012
71   NETMIG2013Net migration in period 7/1/2012 to 6/30/2013
72   NETMIG2014Net migration in period 7/1/2013 to 6/30/2014
73   NETMIG2015Net migration in period 7/1/2014 to 6/30/2015
74   NETMIG2016Net migration in period 7/1/2015 to 6/30/2016
75   NETMIG2017Net migration in period 7/1/2016 to 6/30/2017
76   RESID2010Residual for period 4/1/2010 to 6/30/2010
77   RESID2011Residual for period 7/1/2010 to 6/30/2011
78   RESID2012Residual for period 7/1/2011 to 6/30/2012
79   RESID2013Residual for period 7/1/2012 to 6/30/2013
80   RESID2014Residual for period 7/1/2013 to 6/30/2014
81   RESID2015Residual for period 7/1/2014 to 6/30/2015
82   RESID2016Residual for period 7/1/2015 to 6/30/2016
83   RESID2017Residual for period 7/1/2016 to 6/30/2017
84   RBIRTH2011Birth rate in period 7/1/2010 to 6/30/2011
85   RBIRTH2012Birth rate in period 7/1/2011 to 6/30/2012
86   RBIRTH2013Birth rate in period 7/1/2012 to 6/30/2013
87   RBIRTH2014Birth rate in period 7/1/2013 to 6/30/2014
88   RBIRTH2015Birth rate in period 7/1/2014 to 6/30/2015
89   RBIRTH2016Birth rate in period 7/1/2015 to 6/30/2016
90   RBIRTH2017Birth rate in period 7/1/2016 to 6/30/2017
91   RDEATH2011Death rate in period 7/1/2010 to 6/30/2011
92   RDEATH2012Death rate in period 7/1/2011 to 6/30/2012
93   RDEATH2013Death rate in period 7/1/2012 to 6/30/2013
94   RDEATH2014Death rate in period 7/1/2013 to 6/30/2014
95   RDEATH2015Death rate in period 7/1/2014 to 6/30/2015
96   RDEATH2016Death rate in period 7/1/2015 to 6/30/2016
97   RDEATH2017Death rate in period 7/1/2016 to 6/30/2017
98   RNINC2011Natural increase rate in period 7/1/2010 to 6/30/2011
99   RNINC2012Natural increase rate in period 7/1/2011 to 6/30/2012
100   RNINC2013Natural increase rate in period 7/1/2012 to 6/30/2013
101   RNINC2014Natural increase rate in period 7/1/2013 to 6/30/2014
102   RNINC2015Natural increase rate in period 7/1/2014 to 6/30/2015
103   RNINC2016Natural increase rate in period 7/1/2015 to 6/30/2016
104   RNINC2017Natural increase rate in period 7/1/2016 to 6/30/2017
105   RIMIG2011Net international migration rate in period 7/1/2010 to 6/30/2011
106   RIMIG2012Net international migration rate in period 7/1/2011 to 6/30/2012
107   RIMIG2013Net international migration rate in period 7/1/2012 to 6/30/2013
108   RIMIG2014Net international migration rate in period 7/1/2013 to 6/30/2014
109   RIMIG2015Net international migration rate in period 7/1/2014 to 6/30/2015
110   RIMIG2016Net international migration rate in period 7/1/2015 to 6/30/2016
111   RIMIG2017Net international migration rate in period 7/1/2016 to 6/30/2017
112   RDMIG2011Net domestic migration rate in period 7/1/2010 to 6/30/2011
113   RDMIG2012Net domestic migration rate in period 7/1/2011 to 6/30/2012
114   RDMIG2013Net domestic migration rate in period 7/1/2012 to 6/30/2013
115   RDMIG2014Net domestic migration rate in period 7/1/2013 to 6/30/2014
116   RDMIG2015Net domestic migration rate in period 7/1/2014 to 6/30/2015
117   RDMIG2016Net domestic migration rate in period 7/1/2015 to 6/30/2016
118   RDMIG2017Net domestic migration rate in period 7/1/2016 to 6/30/2017
119   RNMIG2011Net migration rate in period 7/1/2010 to 6/30/2011
120   RNMIG2012Net migration rate in period 7/1/2011 to 6/30/2012
121   RNMIG2013Net migration rate in period 7/1/2012 to 6/30/2013
122   RNMIG2014Net migration rate in period 7/1/2013 to 6/30/2014
123   RNMIG2015Net migration rate in period 7/1/2014 to 6/30/2015
124   RNMIG2016Net migration rate in period 7/1/2015 to 6/30/2016
125   RNMIG2017Net migration rate in period 7/1/2016 to 6/30/2017
126   IMIG1117International Migration 2011-2017 (sum)
127   DMIG1117Domestic Migration 2011-2017 (sum)<
128   NMIG1117Net Migration 2011-2017 (sum)<


How State & Regional Population is Changing .. go top
Use the interactive table above to view the following narrative describing how the population has changed between 2010 and 2017.

The U.S. population grew by 2.3 million between July 1, 2016, and July 1, 2017, representing a 0.72 percent increase to 325.7 million. The population of voting-age residents (adults age 18 and over) grew to 252.1 million (77.4 percent of the 2017 total population), an increase of 0.93 percent from 2016 (249.5 million). Net international migration decreased 1.8 percent between 2016 and 2017, making it the first drop since 2012-2013. Net international migration continues to be a significant factor in the population growth of the U.S., adding over 1.1 million people in the last year.

Eight states lost population between July 1, 2016, and July 1, 2017. Illinois had the largest numeric decline, losing 33,703 people. Wyoming had the largest percentage decline (1.0 percent). Three states that had been losing population in the previous year, Pennsylvania, Connecticut and Vermont, saw slight increases.

States in the South and West continued to lead in population growth. In 2017, 38.0 percent of the nation’s population lived in the South and 23.8 percent lived in the West.

U.S. Regions & Divisions -- a reference guide .. go top
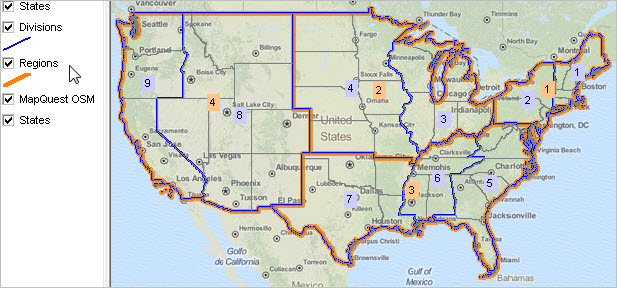
.. view developed with ProximityOne CV XE GIS and related GIS project.

Region 1 - Northeast
  Division 1: New England
  Division 2: Mid-Atlantic
Region 2 - Midwest
  Division 3: East North Central
  Division 4: West North Central
Region 3 - South
  Division 5: South Atlantic
  Division 6: East South Central
  Division 7: West South Central
Region 4 - West
  Division 8: Mountain
  Division 9: Pacific

Natural Change
Natural change is the difference between births and deaths for an area. Often natural change is positive which means that there are more births that deaths for a year or period. This positive natural change is referred to as natural increase. Examples of natural increase exist across the U.S.

The opposite of natural increase, natural decrease, occurs where there are more deaths than births resulting in population decrease. Areas with aging populations often have natural decrease.

Migration
Migration is the movement of people from one area to another. It is often expressed as net migration, which is the difference between how many people move into and out of an area. When net migration is positive, a population has more people moving in than out. Migration is split into domestic migration and international migration.

Domestic migration refers to people moving between areas within the U.S., and is often one of the largest contributors to population change.

International migration refers to people moving into and out of the U.S., and consists of a diverse group of people such as foreign-born immigrants from many countries around the world, members of the U.S. Armed Forces, and U.S. citizens working abroad.

Adding the net domestic and net international migration yields the net migration.

Components of Change
Analyzing the components of change is an enlightening way to understand how the U.S. population is shifting over time. Looking at areas across the country, we can identify groups of areas that grow (or decline) mainly due to migration and others that grow due to natural increase.

About the Data and Reports .. go top
Data included in the interactive table and reports are part of a continuing set of demographic-economic estimates and projections released and updated on a flow basis. See a partial 2018 schedule below. See more about state demographic-economic trends.

Schedule of Related 2018 Updates .. go top
Subject MatterData Reference DateRelease Date
Census Bureau Annual Updates  
  National, State population & components of change /17/1/201712/2017
  Metro, County population & components of change
    2017 section & tables:
    • Metro Trends 2010-2016 interactive table
    • County Trends 2010-2016 interactive table
7/1/20173/2018
  City and town (incorporated place and minor civil division) population
    2017 section & tables:
    • Place Trends 2010-2016 interactive table
7/1/20175/2018
  National, State, and County housing units7/1/20175/2018
  National population by age, sex, race, and Hispanic origin7/1/20176/2018
  State population by age, sex, race, and Hispanic origin7/1/20176/2018
  County population by age, sex, race, and Hispanic origin7/1/20176/2018
ProximityOne Current Estimates & Projections  
  Census Tract, County, Metro, State, U.S. Demographic-EconomicAnnual 2010-20236/2018
  County, Metro, State, U.S. Population Single Year of AgeAnnual 2010-20606/2018
  /1 .. data used in this section

U.S. by State 2017 Population GIS Project/Datasets .. go top
1. Install the ProximityOne CV XE GIS
... omit this step if CV XE GIS software already installed.
... run the CVGIS installer
... take all defaults during installation
2. Download the U.S. by State 2017 GIS project fileset
... requires ProximityOne User Group ID (join now)
... make a new folder c:\states2017.
... unzip U.S. by State 2017 GIS project files to local folder c:\state2017
3. Open the c:\states2017\states2017a.zip project
... after completing the above steps, click File>Open>Dialog
... open the file named c:\states2017\states2017a.gis
4. Done. The start-up view is similar to the graphic shown at the top of this section.

ProximityOne User Group
Join the ProximityOne User Group to keep up-to-date with new developments relating to metros and component geography decision-making information resources. Receive updates and access to tools and resources available only to members. Use this form to join the User Group.

Support Using these Resources
Learn more about accessing and using demographic-economic data and related analytical tools. Join us in a Data Analytics Lab session. There is no fee for these one-hour Web sessions. Each informal session is focused on a specific topic. The open structure also provides for Q&A and discussion of application issues of interest to participants.

Additional Information
ProximityOne develops geodemographic-economic data and analytical tools and helps organizations knit together and use diverse data in a decision-making and analytical framework. We develop custom demographic/economic estimates and projections, develop geographic and geocoded address files, and assist with impact and geospatial analyses. Wide-ranging organizations use our tools (software, data, methodologies) to analyze their own data integrated with other data. Follow ProximityOne on Twitter at www.twitter.com/proximityone. Contact us (888-364-7656) with questions about data covered in this section or to discuss custom estimates, projections or analyses for your areas of interest.


Copyright © . ProximityOne. All Rights Reserved.
Sitemap | Contact Us | News