
|
|
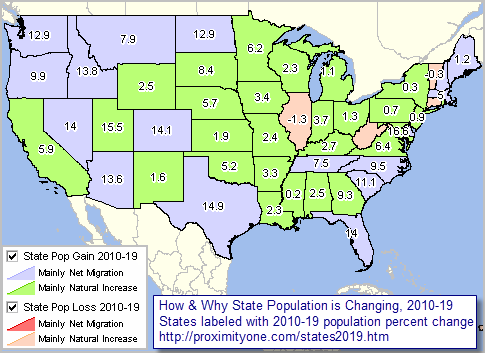
.. U.S. and individual state sections .. frequently updated demographic-economic characteristics & trends January 2020. While 2020 should be a good year for the economy, there are many possible speed bumps. Uncertainty is a top consideration. Risk and opportunities will vary widely by sector and region. Regional economies will change at radically different paces. Success and growth will require an understanding of the "big picture" as well as what's happening at the neighborhood level. How & Why State Population is Changing, 2010-2019 The following graphic shows patterns of how and why state population is changing, 2010 to 2019. States are labeled with population percent change from 2010 to 2019. Color patterns are shown in the inset legend. States experiencing population growth are shown as blue (change due mainly to net migration) and green (change due mainly to natural increase). States experiencing population loss are shown as red (change due mainly to net migration) and orange (change due mainly to natural increase; loss). Use the associated GIS project to examine different years or subject matter items. Click graphic for larger view; expand browser window for best quality view.  .. view developed with ProximityOne CV XE GIS and related GIS project. .. larger view illustrates partial mini-profile/table for Texas demographic items. .. create other views/analyses, integrate other data using the States GIS project State by State Dynamic Reports State of the State reports and information resources provide insights into demographic, economic & business characteristics for the U.S. and individual states. Data are updated daily/weekly on trends, what's changing where & when and assessing what's ahead. Disparate Federal statistical data are presented in an organized, consumable manner. Those data are supplemented by current estimates and projections developed by ProximityOne. A unique resource to help determine how change might affect you, it is an indispensable resource for investors, leaders, policymakers, researchers and decision-makers. Click on a link in the scroll section at right to view the U.S. or selected state. Part of a multi-dimensional information resource, the reports are derived from the Situation & Outlook (S&O) database, updated daily. ProximityOne uses the historical S&O database to develop current demographic-economic estimate and projections. Reports shown via links to the right are illustrative reports. Not all sections are populated. Subscribe to receive the full report. Subscribers have access to the S&O database and can access data in spreadsheet and other formats enabling comparative analysis. Use the Contact form or call 888.364.7656 to register and obtain more information. List names of areas of interest in text section. Topics & Related Information
Each report is organized into sections shown below.
U.S. & States Population Trends
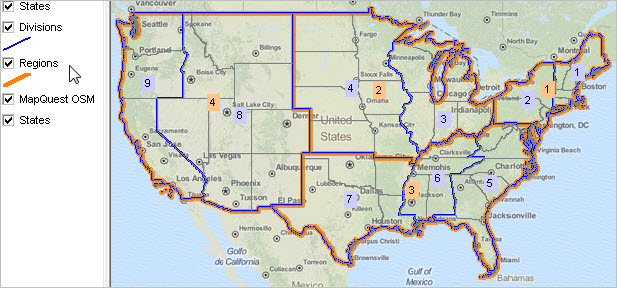
This section also provides access to tools to view and analyze annual population estimates, 2010 to 2020, rankings and components of change for the U.S., regions and states. Use the interactive table below in this section to view, rank, compare these data. Use the GIS tools and ready-to use project described below in this section to create maps for states and regions of interest. Create thematic maps for any of the fields/measures shown in the interactive table. Change color patterns and labels. Integrate your own data. U.S. & States Situation & Outlook interactive table Click column 6 Link to view Situation & Outlook report; updated monthly Click column header to sort; again to sort other direction. Click ShowAll button between queries to refresh. Usage notes below table. See related Interactive Tables Main Page Usage Notes • Click ShowAll between queries/filters. • PopCols button .. click button to view Population 2010-19 columns. U.S. Regions & Divisions -- a reference guide .. go top  .. view developed with ProximityOne CV XE GIS and related GIS project. Region 1 - Northeast Division 1: New England Division 2: Mid-Atlantic Region 2 - Midwest Division 3: East North Central Division 4: West North Central Region 3 - South Division 5: South Atlantic Division 6: East South Central Division 7: West South Central Region 4 - West Division 8: Mountain Division 9: Pacific Natural Change Natural change is the difference between births and deaths for an area. Often natural change is positive which means that there are more births that deaths for a year or period. This positive natural change is referred to as natural increase. Examples of natural increase exist across the U.S. The opposite of natural increase, natural decrease, occurs where there are more deaths than births resulting in population decrease. Areas with aging populations often have natural decrease. Migration Migration is the movement of people from one area to another. It is often expressed as net migration, which is the difference between how many people move into and out of an area. When net migration is positive, a population has more people moving in than out. Migration is split into domestic migration and international migration. Domestic migration refers to people moving between areas within the U.S., and is often one of the largest contributors to population change. International migration refers to people moving into and out of the U.S., and consists of a diverse group of people such as foreign-born immigrants from many countries around the world, members of the U.S. Armed Forces, and U.S. citizens working abroad. Adding the net domestic and net international migration yields the net migration. Components of Change Analyzing the components of change is an enlightening way to understand how the U.S. population is shifting over time. Looking at areas across the country, we can identify groups of areas that grow (or decline) mainly due to migration and others that grow due to natural increase. About the Data and Reports .. go top Data included in the interactive table and reports are part of a continuing set of demographic-economic estimates and projections released and updated on a flow basis. See a partial 2020 schedule below. See more about state demographic-economic trends. Schedule of Related 2020 Updates .. go top
U.S. by State 2019 Population GIS Project/Datasets .. go top 1. Install the ProximityOne CV XE GIS ... requires ProximityOne User Group ID (join now) ... omit this step if CV XE GIS software already installed. ... run the CV XE GIS installer ... take all defaults during installation 2. The U.S. by county view shows at start-up. ... to view state patterns, click on the top 4th & 5th layers to view start patterns as shown in above graphic. 3. Join us in a Data Analytics Lab session to discuss extended uses of this GIS project. ProximityOne User Group Join the ProximityOne User Group to keep up-to-date with new developments relating to metros and component geography decision-making information resources. Receive updates and access to tools and resources available only to members. Use this form to join the User Group. Support Using these Resources Learn more about accessing and using demographic-economic data and related analytical tools. Join us in a Data Analytics Lab session. There is no fee for these one-hour Web sessions. Each informal session is focused on a specific topic. The open structure also provides for Q&A and discussion of application issues of interest to participants. Additional Information ProximityOne develops geodemographic-economic data and analytical tools and helps organizations knit together and use diverse data in a decision-making and analytical framework. We develop custom demographic/economic estimates and projections, develop geographic and geocoded address files, and assist with impact and geospatial analyses. Wide-ranging organizations use our tools (software, data, methodologies) to analyze their own data integrated with other data. Follow ProximityOne on Twitter at www.twitter.com/proximityone. Contact us (888-364-7656) with questions about data covered in this section or to discuss custom estimates, projections or analyses for your areas of interest. |
|
|