 |
|
| Decision-Making Information |
| ProximityOne information resources & solutions (888) DMI-SOLN (888) 364-7656 |
S&O Reports |
United States Alabama Alaska Arizona Arkansas California Colorado Connecticut Delaware District of Columbia Florida Georgia Hawaii Idaho Illinois Indiana Iowa Kansas Kentucky Louisiana Maine Maryland Massachusetts Michigan Minnesota Mississippi Missouri Montana Nebraska Nevada New Hampshire New Jersey New Mexico New York North Carolina North Dakota Ohio Oklahoma Oregon Pennsylvania Rhode Island South Carolina South Dakota Tennessee Texas Utah Vermont Virginia Washington West Virginia Wisconsin |
| 2010 | 2011 | 2012 | 2013 | 2014 | 2015 | 2016 | 2017 | 2018 | 2019 | 2020 | |
| Population | 2,858,190 | 2,869,225 | 2,885,257 | 2,893,212 | 2,900,475 | 2,909,011 | 2,910,844 | 2,908,718 | 2,911,359 | 2,913,314 | 2,914,595 |
| Births | 9,987 | 40,113 | 39,582 | 39,727 | 39,292 | 39,001 | 38,613 | 37,409 | 35,912 | 35,457 | 35,002 |
| Deaths | 5,996 | 25,169 | 24,978 | 25,592 | 25,475 | 26,530 | 26,238 | 27,016 | 25,734 | 25,230 | 24,726 |
| Natural Change | 3,991 | 14,944 | 14,604 | 14,135 | 13,817 | 12,471 | 12,375 | 10,393 | 10,178 | 10,227 | 10,276 |
| Net Migration | 1,138 | -3,903 | 1,352 | -6,184 | -6,531 | -3,838 | -10,521 | -12,486 | -7,511 | -8,253 | -8,995 |
| Int1 Migration | 919 | 4,749 | 5,977 | 5,716 | 6,534 | 9,088 | 7,640 | 2,278 | 4,053 | 4,104 | 4,155 |
| Domestic Migration | 219 | -8,652 | -4,625 | -11,900 | -13,065 | -12,926 | -18,161 | -14,764 | -11,564 | -12,357 | -13,150 |
| Residual | -62 | -6 | 76 | 4 | -23 | -97 | -21 | -33 | -26 | -19 | 0 |
| Net Change | 11,035 | 16,032 | 7,955 | 7,263 | 8,536 | 1,833 | -2,126 | 2,641 | 1,955 | 1,281 | |
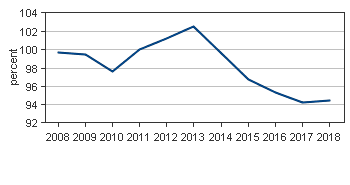
| %Net Change | 0.38 | 0.56 | 0.27 | 0.25 | 0.29 | 0.06 | -0.07 | 0.09 | 0.07 | 0.04 |
| Area | 2010 | 2011 | 2012 | 2013 | 2014 | 2015 | 2016 | 2017 | 2018 |
| Wichita city, KS (79000) | 382,726 | 383,729 | 385,753 | 387,240 | 388,465 | 389,437 | 390,549 | 390,307 | 389,255 |
| Overland Park city, KS (53775) | 174,041 | 176,020 | 178,687 | 180,948 | 184,011 | 186,224 | 189,272 | 191,322 | 192,536 |
| Kansas City city, KS (36000) | 145,883 | 146,233 | 147,482 | 148,942 | 150,187 | 151,635 | 152,617 | 152,938 | 152,958 |
| Olathe city, KS (52575) | 126,249 | 128,295 | 129,945 | 131,789 | 132,839 | 134,279 | 135,883 | 137,501 | 139,605 |
| Topeka city, KS (71000) | 127,913 | 128,216 | 128,087 | 127,726 | 127,496 | 127,422 | 126,989 | 126,583 | 125,904 |
| Lawrence city, KS (38900) | 88,068 | 89,125 | 89,950 | 91,179 | 92,719 | 94,104 | 95,648 | 96,753 | 97,286 |
| Shawnee city, KS (64500) | 62,316 | 63,008 | 63,560 | 64,241 | 64,452 | 64,984 | 65,347 | 65,532 | 65,845 |
| Lenexa city, KS (39350) | 48,289 | 48,858 | 49,349 | 50,278 | 50,926 | 52,425 | 53,011 | 53,547 | 55,294 |
| Manhattan city, KS (44250) | 52,526 | 54,145 | 56,597 | 56,104 | 55,685 | 56,481 | 55,237 | 55,132 | 54,959 |
| Salina city, KS (62700) | 47,926 | 47,920 | 47,979 | 47,923 | 47,722 | 47,659 | 47,237 | 46,843 | 46,716 |
| Hutchinson city, KS (33625) | 42,194 | 42,084 | 41,897 | 41,756 | 41,538 | 41,440 | 41,224 | 40,885 | 40,623 |
| Area | 2010 | 2011 | 2012 | 2013 | 2014 | 2015 | 2016 | 2017 | 2018 |
| Johnson, KS (20091) | 545,665 | 552,872 | 559,451 | 566,411 | 573,043 | 579,708 | 585,921 | 591,284 | 597,555 |
| Sedgwick, KS (20173) | 499,127 | 500,984 | 504,135 | 506,518 | 509,072 | 511,164 | 513,188 | 513,289 | 513,607 |
| Shawnee, KS (20177) | 178,350 | 178,928 | 178,965 | 178,657 | 178,586 | 178,736 | 178,426 | 178,173 | 177,499 |
| Wyandotte, KS (20209) | 157,639 | 158,020 | 159,411 | 160,984 | 162,320 | 163,832 | 164,934 | 165,313 | 165,324 |
| Douglas, KS (20045) | 111,195 | 112,462 | 113,309 | 114,711 | 116,448 | 118,222 | 119,858 | 120,629 | 121,436 |
| Leavenworth, KS (20103) | 76,510 | 77,052 | 77,635 | 78,069 | 78,537 | 79,099 | 80,190 | 81,032 | 81,352 |
| Riley, KS (20161) | 71,553 | 73,419 | 77,499 | 76,936 | 76,485 | 77,149 | 75,163 | 73,982 | 73,703 |
| Butler, KS (20015) | 65,904 | 65,836 | 65,673 | 65,676 | 65,867 | 66,245 | 66,628 | 66,836 | 66,765 |
| Reno, KS (20155) | 64,548 | 64,420 | 64,199 | 64,072 | 63,699 | 63,591 | 63,184 | 62,688 | 62,342 |
| Saline, KS (20169) | 55,783 | 55,778 | 55,836 | 55,762 | 55,524 | 55,453 | 54,977 | 54,529 | 54,401 |
| Crawford, KS (20037) | 39,172 | 39,197 | 39,321 | 39,246 | 39,263 | 39,151 | 39,078 | 39,031 | 39,019 |
| Item | 2016 | 2017 | Chg16-17 | %Chg16-17 |
| Total population | 2,907,289 | 2,913,123 | 5,834 | 0.2 |
| Male | 1,448,853 | 1,452,573 | 3,720 | 0.3 |
| Female | 1,458,436 | 1,460,550 | 2,114 | 0.1 |
| Under 5 years | 197,406 | 193,049 | -4,357 | -2.2 |
| 5 to 9 years | 202,670 | 207,461 | 4,791 | 2.4 |
| 10 to 14 years | 196,909 | 193,992 | -2,917 | -1.5 |
| 15 to 19 years | 205,526 | 202,392 | -3,134 | -1.5 |
| 20 to 24 years | 212,842 | 211,701 | -1,141 | -0.5 |
| 25 to 34 years | 377,168 | 384,111 | 6,943 | 1.8 |
| 35 to 44 years | 353,348 | 354,624 | 1,276 | 0.4 |
| 45 to 54 years | 350,511 | 343,221 | -7,290 | -2.1 |
| 55 to 59 years | 195,172 | 190,176 | -4,996 | -2.6 |
| 60 to 64 years | 178,066 | 184,945 | 6,879 | 3.9 |
| 65 to 74 years | 247,334 | 255,640 | 8,306 | 3.4 |
| 75 to 84 years | 127,211 | 127,857 | 646 | 0.5 |
| 85 years and over | 63,126 | 63,954 | 828 | 1.3 |
| Median age (years) | 36.5 | 36.7 | 0.2 | 0.5 |
| 18 years and over | 2,192,370 | 2,200,548 | 8,178 | 0.4 |
| 21 years and over | 2,057,995 | 2,073,499 | 15,504 | 0.8 |
| 62 years and over | 544,770 | 556,298 | 11,528 | 2.1 |
| 65 years and over | 437,671 | 447,451 | 9,780 | 2.2 |
| Race/Origin | ||||
| One race | 2,803,923 | 2,811,785 | 7,862 | 0.3 |
| White | 2,458,966 | 2,462,215 | 3,249 | 0.1 |
| Black or African American | 166,551 | 167,207 | 656 | 0.4 |
| American Indian and Alaska Native | 21,620 | 21,426 | -194 | -0.9 |
| Asian | 79,741 | 85,840 | 6,099 | 7.6 |
| Native Hawaiian and Other Pacific Islander | 2,922 | 3,712 | 790 | 27.0 |
| Some other race | 74,123 | 71,385 | -2,738 | -3.7 |
| Two or more races | 103,366 | 101,338 | -2,028 | -2.0 |
| Hispanic or Latino (of any race) | 336,909 | 345,510 | 8,601 | 2.6 |
| Mexican | 271,754 | 282,797 | 11,043 | 4.1 |
| Not Hispanic or Latino | 2,570,380 | 2,567,613 | -2,767 | -0.1 |
| White alone� | 2,216,482 | 2,210,739 | -5,743 | -0.3 |
| Black or African American alone | 161,027 | 161,148 | 121 | 0.1 |
| Citizen, 18 and over | 2,077,911 | 2,091,261 | 13,350 | 0.6 |
| Male | 1,021,886 | 1,029,480 | 7,594 | 0.7 |
| Female | 1,056,025 | 1,061,781 | 5,756 | 0.5 |
| Item | 2010 | 2011 | 2012 | 2013 | 2014 | 2015 | 2016 | 2017 | 2018 |
| Total Housing Units | 1,234,458 | 1,238,054 | 1,241,996 | 1,246,678 | 1,253,291 | 1,259,013 | 1,265,735 | 1,273,617 | 1,280,774 |
| Item | 2016 | 2017 | Chg16-17 | %Chg16-17 |
| Total housing units | 1,259,870 | 1,273,776 | 13,906 | 1.1 |
| Occupied housing units (households) | 1,110,407 | 1,128,983 | 18,576 | 1.7 |
| Vacant housing units | 149,463 | 144,793 | -4,670 | -3.1 |
| Homeowner vacancy rate | 2.00 | 1.90 | -0.10 | -5.0 |
| Rental vacancy rate | 8.30 | 7.50 | -0.80 | -9.6 |
| Units in Structure | ||||
| 1-unit, detached | 915,910 | 925,360 | 9,450 | 1.0 |
| 1-unit, attached | 58,009 | 60,761 | 2,752 | 4.7 |
| 2 units | 33,509 | 32,095 | -1,414 | -4.2 |
| 3 or 4 units | 45,429 | 46,613 | 1,184 | 2.6 |
| 5 to 9 units | 48,817 | 48,115 | -702 | -1.4 |
| 10 to 19 units | 45,713 | 44,136 | -1,577 | -3.4 |
| 20 or more units | 58,238 | 61,014 | 2,776 | 4.8 |
| Mobile home | 53,482 | 55,117 | 1,635 | 3.1 |
| Boat, RV, van, etc. | 763 | 565 | -198 | -26.0 |
| Year Structure Built | ||||
| Built 2014 or later | 15,678 | 25,932 | 10,254 | 65.4 |
| Built 2010 or 2013 | 30,595 | 29,286 | -1,309 | -4.3 |
| Built 2000 to 2009 | 145,217 | 140,698 | -4,519 | -3.1 |
| Built 1990 to 1999 | 161,031 | 165,789 | 4,758 | 3.0 |
| Built 1980 to 1989 | 145,377 | 146,154 | 777 | 0.5 |
| Built 1970 to 1979 | 190,411 | 186,364 | -4,047 | -2.1 |
| Built 1960 to 1969 | 124,392 | 139,270 | 14,878 | 12.0 |
| Built 1950 to 1959 | 168,004 | 159,993 | -8,011 | -4.8 |
| Built 1940 to 1949 | 71,883 | 72,167 | 284 | 0.4 |
| Built 1939 or earlier | 207,282 | 208,123 | 841 | 0.4 |
| Total housing units - Median rooms | 6 | 6 | 0 | 0.0 |
| Occupied housing units - Owner-occupied | 729,392 | 743,508 | 14,116 | 1.9 |
| Occupied housing units - Renter-occupied | 381,015 | 385,475 | 4,460 | 1.2 |
| Average household size of owner-occupied unit | 2.65 | 2.63 | -0.02 | -0.8 |
| Average household size of renter-occupied unit | 2.36 | 2.27 | -0.09 | -3.8 |
| Year Moved into Unit; Occupied Housing Units | ||||
| Moved in 2015 or later | 228,368 | 347,950 | 119,582 | 52.4 |
| Moved in 2010 to 2014 | 310,288 | 242,120 | -68,168 | -22.0 |
| Moved in 2000 to 2009 | 288,889 | 257,690 | -31,199 | -10.8 |
| Moved in 1990 to 1999 | 138,623 | 140,067 | 1,444 | 1.0 |
| Moved in 1980 to 1989 | 72,412 | 69,396 | -3,016 | -4.2 |
| Moved in 1979 or earlier | 71,827 | 71,760 | -67 | -0.1 |
| Year Vehicles; Occupied Housing Units | ||||
| No vehicles available | 62,898 | 58,570 | -4,328 | -6.9 |
| 1 vehicle available | 336,083 | 338,860 | 2,777 | 0.8 |
| 2 vehicles available | 431,025 | 442,428 | 11,403 | 2.6 |
| 3 or more vehicles available | 280,401 | 289,125 | 8,724 | 3.1 |
| House Heating; Occupied Housing Units | ||||
| Utility gas | 726,993 | 742,848 | 15,855 | 2.2 |
| Bottled, tank, or LP gas | 82,676 | 79,341 | -3,335 | -4.0 |
| Electricity | 273,250 | 280,820 | 7,570 | 2.8 |
| Fuel oil, kerosene, etc. | 1,671 | 974 | -697 | -41.7 |
| Coal or coke | 39 | 394 | 355 | 910.3 |
| Wood | 18,748 | 16,615 | -2,133 | -11.4 |
| Solar energy | 314 | 264 | -50 | -15.9 |
| occupants per room - 1.00 or less | 1,087,047 | 1,100,111 | 13,064 | 1.2 |
| occupants per room - 1.01 to 1.50 | 15,964 | 20,442 | 4,478 | 28.1 |
| occupants per room - 1.51 or more | 7,396 | 8,430 | 1,034 | 14.0 |
| Housing Value; Occupied Housing Units | ||||
| Less than $50,000 | 86,475 | 81,520 | -4,955 | -5.7 |
| $50,000 to $99,999 | 154,043 | 154,904 | 861 | 0.6 |
| $100,000 to $149,999 | 137,710 | 133,457 | -4,253 | -3.1 |
| $150,000 to $199,999 | 126,267 | 124,581 | -1,686 | -1.3 |
| $200,000 to $299,999 | 124,184 | 134,164 | 9,980 | 8.0 |
| $300,000 to $499,999 | 71,173 | 85,702 | 14,529 | 20.4 |
| $500,000 to $999,999 | 24,959 | 24,557 | -402 | -1.6 |
| $1,000,000 or more | 4,581 | 4,623 | 42 | 0.9 |
| Median (dollars) | 144,900 | 150,600 | 5,700 | 3.9 |
| Mortgage Status; Owner-occupied units - total | 729,392 | 743,508 | 14,116 | 1.9 |
| Occupied housing units -Housing units with a mortgage | 436,010 | 438,620 | 2,610 | 0.6 |
| Occupied housing units - Housing units without a mortgage | 293,382 | 304,888 | 11,506 | 3.9 |
| Rent; Occupied units paying rent | 360,185 | 365,853 | 5,668 | 1.6 |
| Less than $500 | 55,644 | 47,669 | -7,975 | -14.3 |
| $500 to $999 | 203,241 | 212,442 | 9,201 | 4.5 |
| $1,000 to $1,499 | 77,874 | 82,730 | 4,856 | 6.2 |
| $1,500 to $1,999 | 16,513 | 17,396 | 883 | 5.3 |
| $2,000 to $2,499 | 3,063 | 2,943 | -120 | -3.9 |
| $2,500 to $2,999 | 761 | 898 | 137 | 18.0 |
| $3,000 or more | 3,089 | 1,775 | -1,314 | -42.5 |
| Median (dollars) | 789 | 815 | 26 | 3.3 |
| GRAPI; Occupied units paying rent (excl units where GRAPI not computed) | 353,745 | 358,706 | 4,961 | 1.4 |
| Less than 15.0 percent | 58,672 | 56,486 | -2,186 | -3.7 |
| 15.0 to 19.9 percent | 51,864 | 52,922 | 1,058 | 2.0 |
| 20.0 to 24.9 percent | 46,223 | 48,670 | 2,447 | 5.3 |
| 25.0 to 29.9 percent | 42,317 | 42,721 | 404 | 1.0 |
| 30.0 to 34.9 percent | 30,958 | 34,074 | 3,116 | 10.1 |
| 35.0 percent or more | 123,711 | 123,833 | 122 | 0.1 |
| Item | 2010 | 2011 | 2012 | 2013 | 2014 | 2015 | 2016 | 2017 | 2018 |
| Personal income (millions of dollars) | 113,077 | 122,562 | 130,182 | 132,979 | 135,976 | 137,868 | 138,315 | 142,242 | 149,859 |
| Net earnings by place of residence | 74,167 | 80,520 | 85,886 | 89,494 | 89,049 | 89,900 | 89,508 | 91,841 | 96,078 |
| Personal current transfer receipts | 19,190 | 19,626 | 19,355 | 19,639 | 20,380 | 21,301 | 21,971 | 22,495 | 23,576 |
| Income maintenance benefits 1/ | 1,882 | 1,984 | 1,942 | 1,982 | 1,883 | 1,852 | 1,809 | 1,792 | 1,755 |
| Unemployment insurance compensation | 1,145 | 833 | 637 | 451 | 295 | 260 | 224 | 201 | 161 |
| Retirement and other | 16,163 | 16,809 | 16,776 | 17,207 | 18,202 | 19,190 | 19,938 | 20,502 | 21,660 |
| Dividends, interest, and rent | 19,721 | 22,416 | 24,942 | 23,846 | 26,547 | 26,667 | 26,836 | 27,906 | 30,205 |
| Personal dividend income | 5,665 | 7,064 | 8,668 | 8,097 | 9,715 | 9,581 | 9,651 | 9,966 | 10,815 |
| Personal interest income | 11,314 | 11,808 | 12,283 | 11,649 | 12,393 | 12,620 | 12,592 | 13,197 | 14,387 |
| Imputed interest receipts 2/ | 7,871 | 7,996 | 8,120 | 8,065 | 8,422 | 8,780 | 8,736 | 8,735 | 9,156 |
| Monetary interest receipts | 3,443 | 3,812 | 4,163 | 3,584 | 3,971 | 3,840 | 3,856 | 4,462 | 5,231 |
| Rental income of persons | 2,742 | 3,544 | 3,991 | 4,101 | 4,439 | 4,466 | 4,593 | 4,743 | 5,004 |
| Imputed rent | 1,750 | 2,230 | 2,507 | 2,672 | 2,824 | 2,985 | 3,159 | 3,261 | 3,428 |
| Monetary rent | 992 | 1,314 | 1,485 | 1,429 | 1,615 | 1,481 | 1,435 | 1,482 | 1,576 |
| Population (persons) 3/ | 2,858,213 | 2,869,035 | 2,885,361 | 2,893,510 | 2,900,896 | 2,909,502 | 2,911,263 | 2,910,689 | 2,911,505 |
| Per capita personal income 4/ | 39,562 | 42,719 | 45,118 | 45,958 | 46,874 | 47,386 | 47,510 | 48,869 | 51,471 |
| Per capita net earnings 4/ | 25,949 | 28,065 | 29,766 | 30,929 | 30,697 | 30,899 | 30,745 | 31,553 | 32,999 |
| Per capita personal current transfer receipts 4/ | 6,714 | 6,841 | 6,708 | 6,787 | 7,025 | 7,321 | 7,547 | 7,728 | 8,097 |
| Per capita income maintenance benefits 4/ | 658 | 692 | 673 | 685 | 649 | 636 | 621 | 616 | 603 |
| Per capita unemployment insurance compensation 4/ | 401 | 290 | 221 | 156 | 102 | 89 | 77 | 69 | 55 |
| Per capita retirement and other 4/ | 5,655 | 5,859 | 5,814 | 5,947 | 6,275 | 6,596 | 6,849 | 7,044 | 7,439 |
| Per capita dividends, interest, and rent 4/ | 6,900 | 7,813 | 8,644 | 8,241 | 9,151 | 9,165 | 9,218 | 9,587 | 10,374 |
| Per capita dividends 4/ | 1,982 | 2,462 | 3,004 | 2,798 | 3,349 | 3,293 | 3,315 | 3,424 | 3,714 |
| Per capita interest 4/ | 3,959 | 4,116 | 4,257 | 4,026 | 4,272 | 4,338 | 4,325 | 4,534 | 4,941 |
| Per capita rent 4/ | 959 | 1,235 | 1,383 | 1,417 | 1,530 | 1,535 | 1,578 | 1,630 | 1,719 |
| Earnings by place of work | 81,728 | 87,798 | 93,062 | 98,352 | 98,471 | 99,761 | 99,065 | 101,519 | 106,225 |
| Wages and salaries | 56,090 | 58,105 | 60,617 | 61,872 | 64,458 | 66,704 | 67,188 | 68,680 | 71,393 |
| Supplements to wages and salaries | 13,853 | 14,333 | 14,171 | 15,554 | 15,864 | 16,300 | 16,238 | 16,534 | 17,325 |
| Employer contributions for employee pension and insuranc | 9,430 | 9,767 | 9,427 | 10,676 | 10,852 | 11,012 | 11,164 | 11,336 | 11,979 |
| Employer contributions for government social insurance | 4,423 | 4,566 | 4,744 | 4,878 | 5,012 | 5,288 | 5,074 | 5,198 | 5,346 |
| Proprietors' income | 11,786 | 15,360 | 18,274 | 20,926 | 18,150 | 16,757 | 15,639 | 16,305 | 17,508 |
| Farm proprietors' income | 2,128 | 3,163 | 2,501 | 4,485 | 2,196 | 1,224 | 1,559 | 800 | 836 |
| Nonfarm proprietors' income | 9,658 | 12,197 | 15,773 | 16,442 | 15,954 | 15,534 | 14,079 | 15,505 | 16,671 |
| Total employment (number of jobs) | 1,801,873 | 1,819,044 | 1,841,393 | 1,869,054 | 1,895,859 | 1,910,809 | 1,916,297 | 1,917,326 | 1,941,000 |
| Wage and salary employment | 1,407,971 | 1,417,054 | 1,433,074 | 1,447,857 | 1,471,369 | 1,481,671 | 1,480,946 | 1,483,095 | 1,496,653 |
| Proprietors employment | 393,902 | 401,990 | 408,319 | 421,197 | 424,490 | 429,138 | 435,351 | 434,231 | 444,347 |
| Farm proprietors employment 6/ | 53,857 | 53,660 | 52,862 | 53,410 | 52,401 | 51,852 | 50,880 | 50,583 | 50,820 |
| Nonfarm proprietors employment | 340,045 | 348,330 | 355,457 | 367,787 | 372,089 | 377,286 | 384,471 | 383,648 | 393,527 |
| Average earnings per job (dollars) | 45,357 | 48,266 | 50,539 | 52,621 | 51,940 | 52,209 | 51,696 | 52,948 | 54,727 |
| Average wages and salaries | 39,837 | 41,004 | 42,298 | 42,734 | 43,808 | 45,019 | 45,368 | 46,308 | 47,702 |
| Average nonfarm proprietors' income | 28,403 | 35,014 | 44,374 | 44,704 | 42,878 | 41,172 | 36,620 | 40,415 | 42,364 |
| Item | 2016 | 2017 | Chg16-17 | %Chg16-17 |
| Labor Force; Population 16 years and over | 2,273,338 | 2,279,858 | 6,520 | 0.3 |
| In labor force | 1,508,145 | 1,516,538 | 8,393 | 0.6 |
| In labor force - Civilian labor force | 1,493,137 | 1,499,885 | 6,748 | 0.5 |
| In labor force - Civilian labor force - Employed | 1,426,134 | 1,436,801 | 10,667 | 0.7 |
| In labor force - Civilian labor force - Unemployed | 67,003 | 63,084 | -3,919 | -5.8 |
| In labor force - Armed Forces | 15,008 | 16,653 | 1,645 | 11.0 |
| Not in labor force | 765,193 | 763,320 | -1,873 | -0.2 |
| In labor force - Civilian labor force | 1,493,137 | 1,499,885 | 6,748 | 0.5 |
| In labor force - Unemployment Rate | 4.5 | 4.2 | -0.3 | -6.7 |
| Employment by Industry; Civilian employed population 16 years and over | 1,426,134 | 1,436,801 | 10,667 | 0.7 |
| Agriculture, forestry, fishing and hunting, and mining | 41,535 | 44,507 | 2,972 | 7.2 |
| Construction | 86,794 | 92,903 | 6,109 | 7.0 |
| Manufacturing | 181,238 | 177,233 | -4,005 | -2.2 |
| Wholesale trade | 40,615 | 40,345 | -270 | -0.7 |
| Retail trade | 152,259 | 157,215 | 4,956 | 3.3 |
| Transportation and warehousing, and utilities | 68,622 | 71,500 | 2,878 | 4.2 |
| Information | 28,975 | 26,630 | -2,345 | -8.1 |
| Finance and insurance, and real estate and rental and leasing | 81,939 | 86,925 | 4,986 | 6.1 |
| Prof, scientific & management, & admine and waste mgmt services | 142,125 | 133,206 | -8,919 | -6.3 |
| Educational services, and health care and social assistance | 348,217 | 364,823 | 16,606 | 4.8 |
| Arts, entertainment, & recreation, & accommodation & food services | 122,518 | 114,401 | -8,117 | -6.6 |
| Other services, except public administration | 68,866 | 60,570 | -8,296 | -12.0 |
| Public administration | 62,431 | 66,543 | 4,112 | 6.6 |
| Class of Worker; Civilian employed population 16 years and over | 1,426,134 | 1,436,801 | 10,667 | 0.7 |
| Private wage and salary workers | 1,118,091 | 1,115,408 | -2,683 | -0.2 |
| Government workers | 219,827 | 230,339 | 10,512 | 4.8 |
| Self-employed in own not incorporated business workers | 85,789 | 87,782 | 1,993 | 2.3 |
| Unpaid family workers | 2,427 | 3,272 | 845 | 34.8 |
| Household Income; Total households | 1,110,407 | 1,128,983 | 18,576 | 1.7 |
| Less than $10,000 | 68,603 | 64,465 | -4,138 | -6.0 |
| $10,000 to $14,999 | 51,932 | 50,454 | -1,478 | -2.8 |
| $15,000 to $24,999 | 108,929 | 106,799 | -2,130 | -2.0 |
| $25,000 to $34,999 | 117,071 | 113,305 | -3,766 | -3.2 |
| $35,000 to $49,999 | 161,937 | 164,069 | 2,132 | 1.3 |
| $50,000 to $74,999 | 212,296 | 217,940 | 5,644 | 2.7 |
| $75,000 to $99,999 | 139,810 | 145,930 | 6,120 | 4.4 |
| $100,000 to $149,999 | 150,535 | 159,199 | 8,664 | 5.8 |
| $150,000 to $199,999 | 50,333 | 54,354 | 4,021 | 8.0 |
| $200,000 or more | 48,961 | 52,468 | 3,507 | 7.2 |
| Median household income (dollars) | 54,935 | 56,422 | 1,487 | 2.7 |
| Mean household income (dollars) | 73,385 | 75,822 | 2,437 | 3.3 |
| Earnings; Total households with earnings | 882,067 | 896,374 | 14,307 | 1.6 |
| With earnings - Mean earnings (dollars) | 73,783 | 75,972 | 2,189 | 3.0 |
| With Social Security | 339,949 | 339,297 | -652 | -0.2 |
| Mean Social Security income (dollars) | 19,030 | 19,711 | 681 | 3.6 |
| With retirement income | 197,105 | 204,528 | 7,423 | 3.8 |
| Mean retirement income (dollars) | 21,320 | 21,318 | -2 | 0.0 |
| With Supplemental Security Income | 44,272 | 48,464 | 4,192 | 9.5 |
| Mean Supplemental Security Income (dollars) | 9,147 | 9,395 | 248 | 2.7 |
| With cash public assistance income | 17,012 | 18,470 | 1,458 | 8.6 |
| Mean cash public assistance income (dollars) | 2,588 | 2,276 | -312 | -12.1 |
| With Food Stamp/SNAP benefits in the past 12 months | 88,187 | 86,591 | -1,596 | -1.8 |
| Familiy Income; Families | 716,005 | 733,649 | 17,644 | 2.5 |
| Less than $10,000 | 21,583 | 22,746 | 1,163 | 5.4 |
| $10,000 to $14,999 | 17,217 | 15,801 | -1,416 | -8.2 |
| $15,000 to $24,999 | 43,684 | 39,162 | -4,522 | -10.4 |
| $25,000 to $34,999 | 60,206 | 58,744 | -1,462 | -2.4 |
| $35,000 to $49,999 | 91,926 | 95,997 | 4,071 | 4.4 |
| $50,000 to $74,999 | 146,716 | 151,711 | 4,995 | 3.4 |
| $75,000 to $99,999 | 112,729 | 114,649 | 1,920 | 1.7 |
| $100,000 to $149,999 | 132,045 | 138,843 | 6,798 | 5.1 |
| $150,000 to $199,999 | 45,754 | 48,578 | 2,824 | 6.2 |
| $200,000 or more | 44,145 | 47,418 | 3,273 | 7.4 |
| Median family income (dollars) | 70,792 | 72,057 | 1,265 | 1.8 |
| Mean family income (dollars) | 89,261 | 91,517 | 2,256 | 2.5 |
| Per capita income (dollars) | 28,950 | 30,146 | 1,196 | 4.1 |
| Per capita income (dollars) - Nonfamily households | 394,402 | 395,334 | 932 | 0.2 |
| Median nonfamily income (dollars) | 31,227 | 32,327 | 1,100 | 3.5 |
| Mean nonfamily income (dollars) | 41,851 | 43,901 | 2,050 | 4.9 |
| Median earnings for workers (dollars) | 31,098 | 31,839 | 741 | 2.4 |
| Median earnings for male full-time, year-round workers (dollars) | 47,891 | 49,267 | 1,376 | 2.9 |
| Median earnings for female full-time, year-round workers (dollars) | 37,091 | 37,931 | 840 | 2.3 |
| Insurance Coverage; Civilian Noninstitutionalized Population | 2,850,862 | 2,855,454 | 4,592 | 0.2 |
| With health insurance coverage | 2,601,888 | 2,606,062 | 4,174 | 0.2 |
| With private health insurance coverage� | 2,142,144 | 2,128,582 | -13,562 | -0.6 |
| With public health coverage� | 831,350 | 844,422 | 13,072 | 1.6 |
| No health insurance coverage | 248,974 | 249,392 | 418 | 0.2 |
| Item | 2018Q1 | 2018Q2 | 2018Q3 | 2018Q4 | 2019Q1 | 2018Q1 - 2018Q2 | 2018Q2 - 2018Q3 | 2018Q3 - 2018Q4 | 2018Q4 - 2019Q1 | 2018Q1 - 2019Q1 |
| All industry total | 150,447 | 152,448 | 152,910 | 153,241 | 154,405 | 1.3 | 0.3 | 0.2 | 0.8 | 2.6 |
| .Private industries | 132,065 | 133,942 | 134,273 | 134,665 | 135,879 | 1.4 | 0.2 | 0.3 | 0.9 | 2.9 |
| ..Ag, forestry, fishing, hunting | 5,609 | 5,220 | 4,902 | 4,762 | 5,241 | -6.9 | -6.1 | -2.9 | 10.1 | -6.6 |
| ..Mining, quarrying, oil & gas ext | 1,274 | 1,414 | 1,249 | 1,326 | 1,412 | 11.0 | -11.7 | 6.2 | 6.5 | 10.8 |
| ..Utilities | 2,519 | 2,741 | 2,616 | 2,626 | 2,634 | 8.8 | -4.6 | 0.4 | 0.3 | 4.6 |
| ..Construction | 4,695 | 4,788 | 4,842 | 4,785 | 4,750 | 2.0 | 1.1 | -1.2 | -0.7 | 1.2 |
| ..Manufacturing | 24,674 | 24,842 | 25,228 | 25,312 | 25,619 | 0.7 | 1.6 | 0.3 | 1.2 | 3.8 |
| ...Durable goods manufacturing | 12,817 | 13,312 | 13,417 | 13,525 | 13,570 | 3.9 | 0.8 | 0.8 | 0.3 | 5.9 |
| ...Nondurable goods manufacturing | 11,837 | 11,484 | 11,769 | 11,741 | 12,010 | -3.0 | 2.5 | -0.2 | 2.3 | 1.5 |
| ..Wholesale trade | 10,479 | 10,904 | 10,606 | 10,815 | 10,735 | 4.1 | -2.7 | 2.0 | -0.7 | 2.4 |
| ..Retail trade | 9,950 | 9,847 | 9,935 | 9,865 | 10,145 | -1.0 | 0.9 | -0.7 | 2.8 | 2.0 |
| ..Transportation and warehousing | 5,719 | 5,762 | 5,782 | 5,770 | 5,736 | 0.8 | 0.3 | -0.2 | -0.6 | 0.3 |
| ..Information | 6,316 | 6,466 | 6,552 | 6,643 | 6,706 | 2.4 | 1.3 | 1.4 | 0.9 | 6.2 |
| ..Finance and insurance | 7,475 | 7,608 | 7,717 | 7,622 | 7,774 | 1.8 | 1.4 | -1.2 | 2.0 | 4.0 |
| ..Real estate & rental & leasing | 17,215 | 17,409 | 17,360 | 17,469 | 17,441 | 1.1 | -0.3 | 0.6 | -0.2 | 1.3 |
| ..Prof, scientific, technical services | 8,590 | 8,684 | 8,869 | 8,913 | 8,956 | 1.1 | 2.1 | 0.5 | 0.5 | 4.3 |
| ..Mgmt of companies & enterprises | 3,506 | 3,663 | 3,680 | 3,682 | 3,749 | 4.5 | 0.5 | 0.0 | 1.8 | 7.0 |
| ..Admin & support & waste mgmt | 4,432 | 4,531 | 4,651 | 4,750 | 4,749 | 2.2 | 2.6 | 2.1 | 0.0 | 7.1 |
| ..Educational services | 963 | 989 | 963 | 950 | 952 | 2.7 | -2.6 | -1.3 | 0.2 | -1.1 |
| ..Health care and social assistance | 11,207 | 11,383 | 11,478 | 11,548 | 11,706 | 1.6 | 0.8 | 0.6 | 1.4 | 4.5 |
| ..Arts, entertainment, and recreation | 779 | 828 | 823 | 815 | 816 | 6.4 | -0.6 | -1.0 | 0.1 | 4.7 |
| ..Accommodation and food services | 3,304 | 3,304 | 3,323 | 3,322 | 3,318 | 0.0 | 0.6 | 0.0 | -0.1 | 0.4 |
| ..Other services (except gov/gov ent) | 3,082 | 3,157 | 3,130 | 3,133 | 3,114 | 2.4 | -0.9 | 0.0 | -0.6 | 1.0 |
| .Govt & govt enterprises | 18,486 | 18,619 | 18,746 | 18,690 | 18,653 | 0.7 | 0.7 | -0.3 | -0.2 | 0.9 |
| Item | 2010 | 2011 | 2012 | 2013 | 2014 | 2015 | 2016 | 2017 | 2018 |
| All industry total | 134,945 | 138,563 | 140,478 | 140,506 | 143,154 | 144,932 | 148,249 | 149,421 | 152,262 |
| .Private industries | 115,175 | 118,642 | 120,746 | 121,135 | 123,992 | 126,374 | 129,723 | 130,975 | 133,736 |
| ..Agriculture, forestry, fishing, & | 6,257 | 6,376 | 5,402 | 7,111 | 5,304 | 5,344 | 7,057 | 5,355 | 5,123 |
| ...Farms | 5,954 | 6,085 | 5,081 | 6,811 | 5,000 | 5,020 | 6,788 | 5,033 | -1 |
| ...Forestry, fishing, & related act | 301 | 292 | 321 | 301 | 297 | 314 | 315 | 309 | -1 |
| ..Mining, quarrying, & oil & gas ex | 1,978 | 1,969 | 2,292 | 2,244 | 2,242 | 1,999 | 1,640 | 1,499 | 1,316 |
| ...Oil & gas extraction | 1,232 | 1,210 | 1,511 | 1,474 | 1,462 | 1,642 | 1,543 | 1,274 | -1 |
| ...Mining (except oil & gas) | 229 | 200 | 170 | 168 | 144 | 167 | 150 | 158 | -1 |
| ...Support activities for mining | 522 | 569 | 611 | 602 | 633 | 324 | 183 | 205 | -1 |
| ..Utilities | 2,529 | 2,869 | 2,886 | 2,926 | 2,720 | 2,487 | 2,709 | 2,618 | 2,625 |
| ..Construction | 4,770 | 4,611 | 4,945 | 4,921 | 4,943 | 4,912 | 4,933 | 4,767 | 4,777 |
| ..Manufacturing | 21,469 | 23,407 | 22,982 | 19,473 | 21,541 | 22,483 | 22,972 | 23,859 | 25,014 |
| ...Durable goods | 11,925 | 12,634 | 12,017 | 10,078 | 10,898 | 11,568 | 12,324 | 12,490 | 13,268 |
| ....Wood product | 111 | 98 | 119 | 129 | 99 | 134 | 141 | 142 | -1 |
| ....Nonmetallic mineral product | 450 | 388 | 458 | 541 | 510 | 525 | 499 | 495 | -1 |
| ....Primary metal | 155 | 201 | 244 | 185 | 208 | 173 | 157 | 138 | -1 |
| ....Fabricated metal product | 1,071 | 1,065 | 1,134 | 1,216 | 1,256 | 1,203 | 1,221 | 1,283 | -1 |
| ....Machinery | 1,499 | 1,816 | 1,786 | 1,759 | 1,771 | 1,693 | 1,493 | 1,592 | -1 |
| ....Computer & electronic product | 1,277 | 1,237 | 1,117 | 1,161 | 745 | 707 | 637 | 649 | -1 |
| ....Electrical equipment, appliance | 423 | 398 | 299 | 335 | 382 | 420 | 480 | 536 | -1 |
| ....Motor vehicles, bodies & traile | 1,029 | 1,283 | 1,224 | 1,068 | 1,072 | 994 | 1,028 | 896 | -1 |
| ....Other transportation equipment | 5,345 | 5,619 | 5,165 | 3,201 | 4,336 | 5,191 | 6,099 | 6,181 | -1 |
| ....Furniture & related product | 235 | 212 | 166 | 186 | 199 | 215 | 227 | 234 | -1 |
| ....Miscellaneous | 325 | 315 | 305 | 293 | 301 | 293 | 334 | 347 | -1 |
| ...Nondurable goods | 9,504 | 10,764 | 10,966 | 9,400 | 10,663 | 10,919 | 10,583 | 11,348 | 11,708 |
| ....Food & beverage & tobacco produ | 3,539 | 3,588 | 3,369 | 3,259 | 3,538 | 3,727 | 3,467 | 3,978 | -1 |
| ....Textile mills & textile product | 50 | 45 | 59 | 61 | 50 | 47 | 46 | 47 | -1 |
| ....Apparel, leather, & allied prod | 66 | 64 | 71 | 46 | 41 | 44 | 44 | 40 | -1 |
| ....Paper | 132 | 136 | 184 | 239 | 199 | 216 | 230 | 217 | -1 |
| ....Printing & related support acti | 828 | 849 | 951 | 943 | 800 | 796 | 801 | 788 | -1 |
| ....Petroleum & coal products | 1,707 | 3,079 | 3,789 | 2,491 | 3,769 | 3,568 | 3,443 | 3,545 | -1 |
| ....Chemical | 2,095 | 2,120 | 1,653 | 1,394 | 1,484 | 1,615 | 1,640 | 1,682 | -1 |
| ....Plastics & rubber products | 863 | 879 | 890 | 906 | 884 | 928 | 934 | 992 | -1 |
| ..Wholesale trade | 9,487 | 9,283 | 9,537 | 9,794 | 10,260 | 10,111 | 10,059 | 10,188 | 10,701 |
| ..Retail trade | 8,528 | 8,760 | 8,716 | 8,936 | 8,878 | 9,197 | 9,538 | 9,726 | 9,899 |
| ..Transportation & warehousing | 4,912 | 5,170 | 5,414 | 5,536 | 5,235 | 5,379 | 5,319 | 5,673 | 5,758 |
| ...Air transportation | 77 | 73 | 73 | 75 | 55 | 61 | 57 | 75 | -1 |
| ...Rail transportation | 1,743 | 1,765 | 1,780 | 1,562 | 1,547 | 1,551 | 1,460 | 1,461 | -1 |
| ...Water transportation | 1 | 1 | 4 | 6 | 2 | 0 | 0 | 1 | -1 |
| ...Truck transportation | 1,450 | 1,508 | 1,499 | 1,491 | 1,535 | 1,547 | 1,540 | 1,591 | -1 |
| ...Transit & ground passenger trans | 146 | 144 | 146 | 147 | 161 | 162 | 152 | 165 | -1 |
| ...Pipeline transportation | 258 | 336 | 505 | 797 | 505 | 668 | 647 | 810 | -1 |
| ...Other transportation & support a | 790 | 874 | 877 | 892 | 858 | 826 | 814 | 807 | -1 |
| ...Warehousing & storage | 452 | 474 | 530 | 563 | 581 | 571 | 669 | 792 | -1 |
| ..Information | 4,963 | 4,477 | 4,873 | 6,729 | 6,959 | 5,203 | 5,614 | 6,245 | 6,494 |
| ...Publishing industries (except In | 1,063 | 1,004 | 1,073 | 1,033 | 960 | 882 | 876 | 1,017 | -1 |
| ...Motion picture & sound recording | 96 | 87 | 81 | 99 | 125 | 141 | 137 | 139 | -1 |
| ...Broadcasting (except Internet) & | 3,513 | 3,067 | 3,431 | 5,292 | 5,467 | 3,636 | 3,900 | 4,360 | -1 |
| ...Data processing, hosting, & othe | 291 | 320 | 288 | 306 | 412 | 537 | 699 | 724 | -1 |
| ..Finance, insurance, real estate, | 20,436 | 21,337 | 22,354 | 21,232 | 22,480 | 23,372 | 25,039 | 25,056 | 24,910 |
| ...Finance & insurance | 6,018 | 6,577 | 7,517 | 7,387 | 7,561 | 7,529 | 8,139 | 7,999 | 7,605 |
| ....Monetary Authorities- central b | 2,093 | 2,378 | 2,426 | 2,049 | 2,076 | 2,138 | 2,137 | 2,082 | -1 |
| ....Securities, commodity contracts | 811 | 713 | 936 | 963 | 778 | 772 | 829 | 786 | -1 |
| ....Insurance carriers & related ac | 3,028 | 3,371 | 4,083 | 4,331 | 4,693 | 4,621 | 4,991 | 5,223 | -1 |
| ....Funds, trusts, & other financia | 105 | 128 | 73 | 47 | 47 | 17 | 204 | 16 | -1 |
| ...Real estate & rental & leasing | 14,404 | 14,754 | 14,837 | 13,844 | 14,924 | 15,863 | 16,918 | 17,085 | 17,363 |
| ....Real estate | 11,431 | 12,155 | 12,614 | 12,441 | 12,512 | 12,418 | 12,500 | 12,552 | -1 |
| ....Rental & leasing services & les | 2,972 | 2,598 | 2,222 | 1,399 | 2,429 | 3,518 | 4,588 | 4,716 | -1 |
| ..Professional & business services | 11,973 | 12,364 | 12,981 | 13,753 | 14,553 | 16,229 | 15,844 | 16,230 | 16,932 |
| ...Professional, scientific, & tech | 6,315 | 6,431 | 6,844 | 7,209 | 7,531 | 8,057 | 8,364 | 8,471 | 8,764 |
| ....Legal services | 858 | 859 | 845 | 862 | 802 | 763 | 805 | 810 | -1 |
| ....Computer systems design & relat | 1,138 | 1,163 | 1,299 | 1,417 | 1,530 | 2,170 | 2,439 | 2,526 | -1 |
| ....Miscellaneous professional, sci | 4,321 | 4,411 | 4,700 | 4,931 | 5,206 | 5,168 | 5,180 | 5,204 | -1 |
| ...Management of companies & enterp | 1,796 | 1,714 | 1,757 | 1,948 | 2,424 | 3,834 | 3,236 | 3,477 | 3,632 |
| ...Administrative & support & waste | 3,864 | 4,219 | 4,380 | 4,596 | 4,607 | 4,401 | 4,290 | 4,340 | 4,591 |
| ....Administrative & support servic | 3,541 | 3,946 | 4,091 | 4,309 | 4,322 | 4,087 | 3,962 | 4,004 | -1 |
| ....Waste management & remediation | 324 | 273 | 289 | 287 | 285 | 313 | 327 | 334 | -1 |
| ..Educational services, health care | 11,100 | 11,274 | 11,437 | 11,581 | 11,655 | 12,042 | 11,946 | 12,045 | 12,363 |
| ...Educational services | 1,062 | 1,056 | 1,038 | 1,024 | 1,033 | 1,025 | 986 | 960 | 966 |
| ...Health care & social assistance | 10,039 | 10,218 | 10,399 | 10,558 | 10,622 | 11,019 | 10,965 | 11,091 | 11,404 |
| ....Ambulatory health care services | 4,682 | 4,820 | 4,881 | 4,933 | 4,976 | 5,194 | 5,059 | 5,157 | -1 |
| ....Hospitals | 3,227 | 3,289 | 3,373 | 3,434 | 3,453 | 3,576 | 3,666 | 3,711 | -1 |
| ....Nursing & residential care faci | 1,352 | 1,365 | 1,367 | 1,402 | 1,408 | 1,405 | 1,359 | 1,327 | -1 |
| ....Social assistance | 777 | 744 | 778 | 789 | 784 | 844 | 872 | 890 | -1 |
| ..Arts, entertainment, recreation, | 3,704 | 3,721 | 3,888 | 3,847 | 4,136 | 4,347 | 4,134 | 4,133 | 4,120 |
| ...Arts, entertainment, & recreatio | 538 | 561 | 666 | 639 | 711 | 830 | 777 | 787 | 811 |
| ....Performing arts, spectator spor | 139 | 139 | 150 | 134 | 136 | 161 | 130 | 132 | -1 |
| ....Amusement, gambling, & recreati | 398 | 422 | 516 | 504 | 575 | 669 | 648 | 656 | -1 |
| ...Accommodation & food services | 3,166 | 3,161 | 3,222 | 3,208 | 3,425 | 3,520 | 3,359 | 3,348 | 3,313 |
| ....Accommodation | 468 | 516 | 510 | 490 | 599 | 617 | 543 | 551 | -1 |
| ....Food services & drinking places | 2,698 | 2,645 | 2,713 | 2,718 | 2,826 | 2,902 | 2,815 | 2,797 | -1 |
| ..Other services (except government | 3,074 | 3,063 | 3,039 | 3,019 | 3,025 | 3,030 | 2,992 | 3,090 | 3,126 |
| .Government & government enterprise | 19,762 | 19,919 | 19,731 | 19,374 | 19,179 | 18,609 | 18,605 | 18,538 | 18,635 |
| ..Federal civilian | 2,772 | 2,757 | 2,623 | 2,300 | 2,318 | 2,458 | 2,523 | 2,598 | -1 |
| ..Military | 3,439 | 3,393 | 3,320 | 3,125 | 2,984 | 2,863 | 2,647 | 2,568 | -1 |
| ..State & local | 13,549 | 13,767 | 13,788 | 13,942 | 13,868 | 13,288 | 13,426 | 13,365 | -1 |
| Natural resources & mining | 8,205 | 8,307 | 7,694 | 9,349 | 7,565 | 7,389 | 8,928 | 6,999 | 6,579 |
| Trade | 18,014 | 18,043 | 18,253 | 18,731 | 19,139 | 19,310 | 19,598 | 19,915 | 20,606 |
| Transportation & utilities | 7,431 | 8,042 | 8,300 | 8,462 | 7,954 | 7,857 | 8,019 | 8,284 | 8,378 |
| Private goods-producing industries | 34,456 | 36,333 | 35,622 | 33,790 | 34,110 | 34,905 | 36,507 | 35,961 | 36,900 |
| Private services-providing industri | 80,695 | 82,315 | 85,125 | 87,335 | 89,863 | 91,456 | 93,256 | 94,976 | 96,810 |
| Item | 2010 | 2011 | 2012 | 2013 | 2014 | 2015 | 2016 | 2017 | 2018 |
| Civilian NonInstitutional Population | 2,148,634 | 2,161,316 | 2,173,804 | 2,183,069 | 2,193,807 | 2,203,905 | 2,213,001 | 2,217,353 | 2,221,713 |
| Civilian Labor Force | 1,500,764 | 1,491,087 | 1,485,220 | 1,485,917 | 1,492,158 | 1,490,689 | 1,485,321 | 1,478,713 | 1,482,220 |
| .. as percent of CNP | 69.8 | 69.0 | 68.3 | 68.1 | 68.0 | 67.6 | 67.1 | 66.7 | 66.7 |
| Employment | 1,394,958 | 1,394,082 | 1,400,122 | 1,407,217 | 1,424,439 | 1,428,557 | 1,425,433 | 1,424,724 | 1,432,387 |
| .. as percent of CLF | 64.9 | 64.5 | 64.4 | 64.5 | 64.9 | 64.8 | 64.4 | 64.3 | 64.5 |
| Unemployment | 105,806 | 97,005 | 85,098 | 78,700 | 67,719 | 62,132 | 59,888 | 53,989 | 49,833 |
| .. as percent of CLF | 7.1 | 6.5 | 5.7 | 5.3 | 4.5 | 4.2 | 4.0 | 3.7 | 3.4 |
| Item | 2010 | 2011 | 2012 | 2013 | 2014 | 2015 | 2016 | 2017 | 2018 |
| Personal consumption expenditures | 85,462 | 89,189 | 92,119 | 94,035 | 97,374 | 100,200 | 102,838 | 106,176 | 110,339 |
| Goods | 30,001 | 31,775 | 33,067 | 33,586 | 34,406 | 34,570 | 34,912 | 35,609 | 36,658 |
| Durable goods | 9,730 | 9,921 | 10,560 | 10,813 | 11,140 | 11,653 | 12,041 | 12,243 | 12,530 |
| Motor vehicles and parts | 3,401 | 3,496 | 3,891 | 3,924 | 4,028 | 4,236 | 4,276 | 4,354 | 4,515 |
| Furnishings and durable household equipment | 2,344 | 2,370 | 2,477 | 2,535 | 2,714 | 2,858 | 3,073 | 3,149 | 3,169 |
| Recreational goods and vehicles | 2,627 | 2,611 | 2,686 | 2,822 | 2,853 | 2,955 | 3,096 | 3,144 | 3,204 |
| Other durable goods | 1,358 | 1,445 | 1,507 | 1,532 | 1,544 | 1,604 | 1,595 | 1,596 | 1,641 |
| Nondurable goods | 20,271 | 21,854 | 22,507 | 22,774 | 23,266 | 22,918 | 22,871 | 23,367 | 24,128 |
| Food and beverages purchased for off-premises consumption | 7,472 | 7,886 | 8,033 | 8,080 | 8,298 | 8,482 | 8,590 | 8,756 | 8,835 |
| Clothing and footwear | 2,438 | 2,524 | 2,600 | 2,607 | 2,637 | 2,683 | 2,705 | 2,693 | 2,752 |
| Gasoline and other energy goods | 3,130 | 3,912 | 3,970 | 4,055 | 3,957 | 3,115 | 2,781 | 3,017 | 3,339 |
| Other nondurable goods | 7,232 | 7,533 | 7,905 | 8,032 | 8,374 | 8,637 | 8,795 | 8,901 | 9,202 |
| Services | 55,461 | 57,415 | 59,052 | 60,449 | 62,968 | 65,630 | 67,926 | 70,567 | 73,680 |
| Household consumption expenditures (for services) | 53,256 | 54,993 | 56,403 | 57,812 | 60,267 | 62,940 | 65,058 | 67,581 | 70,474 |
| Housing and utilities | 14,511 | 14,863 | 15,169 | 15,647 | 16,329 | 16,993 | 17,786 | 18,482 | 19,328 |
| Health care | 15,098 | 15,750 | 16,462 | 16,623 | 17,014 | 17,721 | 18,017 | 18,488 | 19,193 |
| Transportation services | 2,281 | 2,356 | 2,390 | 2,451 | 2,570 | 2,652 | 2,751 | 2,807 | 2,898 |
| Recreation services | 3,216 | 3,175 | 3,251 | 3,429 | 3,581 | 3,650 | 3,701 | 3,754 | 3,814 |
| Food services and accommodations | 4,904 | 5,104 | 5,351 | 5,475 | 5,729 | 6,100 | 6,233 | 6,433 | 6,698 |
| Financial services and insurance | 6,521 | 6,822 | 6,859 | 7,186 | 7,680 | 8,306 | 8,704 | 9,341 | 9,941 |
| Other services | 6,726 | 6,925 | 6,923 | 7,003 | 7,363 | 7,519 | 7,867 | 8,277 | 8,602 |
| Final consumption expenditures of nonprofits serving households | 2,205 | 2,422 | 2,649 | 2,636 | 2,702 | 2,689 | 2,869 | 2,986 | 3,207 |
| Gross output of nonprofits | 9,191 | 9,646 | 10,105 | 10,259 | 10,648 | 11,147 | 11,831 | 12,305 | 12,922 |
| Less: Receipts from sales of goods and services by nonprofits | 6,986 | 7,225 | 7,456 | 7,623 | 7,946 | 8,457 | 8,963 | 9,319 | 9,715 |
| Item | 2016 | 2017 | Chg16-17 | %Chg16-17 |
| Total households | 1,110,407 | 1,128,983 | 18,576 | 1.7 |
| Family households (families) | 716,005 | 733,649 | 17,644 | 2.5 |
| Nonfamily households | 394,402 | 395,334 | 932 | 0.2 |
| Nonfamily households - Householder living alone | 328,183 | 327,502 | -681 | -0.2 |
| Average household size | 2.55 | 2.51 | -0.04 | -1.6 |
| Average family size | 3.17 | 3.10 | -0.07 | -2.2 |
| Population in households | 2,828,247 | 2,832,963 | 4,716 | 0.2 |
| Enrolled in School; Population 3 years and over enrolled in school | 774,902 | 777,271 | 2,369 | 0.3 |
| Nursery school, preschool | 50,128 | 56,855 | 6,727 | 13.4 |
| Kindergarten | 39,302 | 40,024 | 722 | 1.8 |
| Elementary school (grades 1-8) | 318,192 | 315,626 | -2,566 | -0.8 |
| High school (grades 9-12) | 158,802 | 158,337 | -465 | -0.3 |
| College or graduate school | 208,478 | 206,429 | -2,049 | -1.0 |
| Educational Attainment; Population 25 years and over | 1,891,936 | 1,904,528 | 12,592 | 0.7 |
| Less than 9th grade | 68,491 | 66,505 | -1,986 | -2.9 |
| 9th to 12th grade, no diploma | 110,352 | 104,758 | -5,594 | -5.1 |
| High school graduate (includes equivalency) | 496,294 | 490,769 | -5,525 | -1.1 |
| Some college, no degree | 438,343 | 432,206 | -6,137 | -1.4 |
| Associate's degree | 157,030 | 167,548 | 10,518 | 6.7 |
| Bachelor's degree | 390,861 | 403,542 | 12,681 | 3.2 |
| Graduate or professional degree | 230,565 | 239,200 | 8,635 | 3.7 |
| Percent high school graduate or higher | 90.5 | 91.0 | 0.5 | 0.6 |
| Percent bachelor's degree or higher | 32.8 | 33.7 | 0.9 | 2.7 |
| Mobility/Migration; Residence one year age - Population 1 year and over | 2,870,529 | 2,876,925 | 6,396 | 0.2 |
| Same house | 2,394,351 | 2,413,141 | 18,790 | 0.8 |
| Different house in the U.S. | 458,801 | 452,301 | -6,500 | -1.4 |
| Same county | 269,550 | 260,147 | -9,403 | -3.5 |
| Different county | 189,251 | 192,154 | 2,903 | 1.5 |
| Different county - Same state | 100,421 | 106,000 | 5,579 | 5.6 |
| Different county - Different state | 88,830 | 86,154 | -2,676 | -3.0 |
| Abroad | 17,377 | 11,483 | -5,894 | -33.9 |
| Nativity | ||||
| Native | 2,701,767 | 2,712,566 | 10,799 | 0.4 |
| Born in United States | 2,675,058 | 2,686,971 | 11,913 | 0.4 |
| Born in United States - State of residence | 1,719,366 | 1,734,866 | 15,500 | 0.9 |
| Born in United States - Different state | 955,692 | 952,105 | -3,587 | -0.4 |
| Born in PR, U.S. Island or born abroad to Americans | 26,709 | 25,595 | -1,114 | -4.2 |
| Foreign born | 205,522 | 200,557 | -4,965 | -2.4 |
| Foreign-born population | 205,522 | 200,557 | -4,965 | -2.4 |
| Naturalized U.S. citizen | 81,256 | 81,129 | -127 | -0.2 |
| Not a U.S. citizen | 124,266 | 119,428 | -4,838 | -3.9 |
| Language Sooken at Home; Population 5 years and over | 2,709,883 | 2,720,074 | 10,191 | 0.4 |
| English only | 2,393,978 | 2,395,860 | 1,882 | 0.1 |
| Language other than English | 315,905 | 324,214 | 8,309 | 2.6 |
| Language other than English - Speak English less than "very well" | 125,113 | 123,692 | -1,421 | -1.1 |
| Spanish | 210,787 | 211,889 | 1,102 | 0.5 |
| Spanish - Speak English less than "very well" | 85,664 | 81,479 | -4,185 | -4.9 |
| Computer Access; Total households | 1,110,407 | 1,128,983 | 18,576 | 1.7 |
| With a computer | 982,827 | 1,024,163 | 41,336 | 4.2 |
| With a computer - With a broadband Internet subscription | 891,380 | 936,582 | 45,202 | 5.1 |
|
|