|
|
|
State Trends Main Situation & Outlook - S&O Desktop - S&O Server - S&O Profiles|Reports > Comparative > Narrative > Site Analysis CVXE GIS Tools Data Resources Guide - projections to 2060 Related Sections - Applications Gallery - States - Congressional District - School Districts - Counties - Cities/Places - Tracts/Neighborhoods - Block Groups - Census Blocks - ZIP Codes - Urban Areas Demographic-Economic Estimates-Projections GIS Thematic Mapping Visual Analysis Tools Ranking Tables National Scope Demographic Change 2000-2010 - States - Metros - Congressional District - School Districts - Counties - Cities/Places - Census Tracts |
State Median Household Income Patterns: 2000-2012
From 2000 to 2012, real U.S. median household income decreased 6.6 percent. The U.S. median household income decreased from $55,030 in 2000 to $51,371 in 2012. 35 states showed statistically significant decreases in real median household income from 2000 to 2012. These data are based on American Community Survey (ACS) estimates (more about the latest ACS 2012 data). Use the interactive ranking table in this section to examine the population components of change for the U.S. and by state. Median Household Income by State; Percent Change 2000-2012 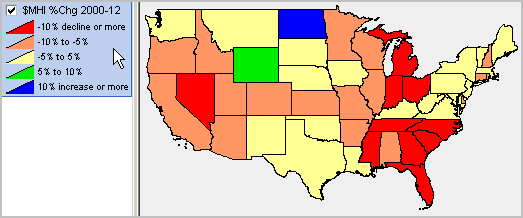 Intervals and color patterns are shown in legend at left of map. View developed with CV XE GIS. Make your thematic pattern map. Zoom to regions of interest. Label areas. Add your own geography/data. Subject matter items shown in table below are included in start-up state layer; install CV XE GIS. State Median Household Income Patterns: 2000-2012 -- Interactive Table Click column header to sort; click again to sort other direction. See related Ranking Tables Main Page Usage Notes • Data for 2000 are based on the Census 2000 Supplemental Survey. Data for 2011 and 2012 are based on ACS 1 year estimates. • Household income includes income of the householder and all other people 15 years and older in the household, whether or not they are related to the householder. • Median is the point that divides the household income distribution into halves, one-half with income above the median and the other with income below the median. The median is based on the income distribution of all households, including those with no income. • All income data inflation-adjusted to 2012 dollars. "Real" refers to income after adjusting for inflation. • Data are limited to household population and exclude population living in institutions, college dormitories, and other group quarters. • Medians were calculated from microdata and household distributions using 2012 dollars. Published estimates inflation adjusted by the CPI-U-RS will not match exactly to these estimates. Table Operations • Click on a column header to sort on that column; click column header again to sort in other direction. • Click ShowAll button to show all areas and restore full set of data view; this resets to start-up view. • Click Median Age button to view median age data. • Navigate across rows/vertically in table: click in table on cell and arrow/page up/down or use scroll bar at right of table. • See related ranking tables. Copy/Export Data Copy a Row to Clipboard. Click a record/row of interest and it turns blue. Right-click the blue-colored row and choose Copy to copy all cells in that row to clipboard. Optionally paste these cell values into spreadsheet/other application for extended viewing/analysis. Column Headers Area Name $MHI 2000 -- median household income, 2000 $MHI 2011 -- median household income, 2011 $MHI 2012 -- median household income, 2012 $Ch00-12 -- change in median household income, 2000-2012 %Ch00-12 -- percent change in median household income, 2000-2012 $Ch11-12 -- change in median household income, 2011-2012 %Ch11-12 -- percent change in median household income, 2011-2012 Additional Information ProximityOne develops geographic-demographic-economic data and analytical tools and helps organizations knit together and use diverse data in a decision-making and analytical framework. We develop custom demographic/economic estimates and projections, develop geographic and geocoded address files, and assist with impact and geospatial analyses. Wide-ranging organizations use our tools (software, data, methodologies) to analyze their own data integrated with other data. Follow ProximityOne on Twitter at www.twitter.com/proximityone. Contact ProximityOne (888-364-7656) with questions about data covered in this section or to discuss custom estimates, projections or analyses for your areas of interest. |
|
|