New York

Contents
Selected CV XE GIS project/application views in New York.
Navigate to sub-state areas: click on expanding text menu in left panel to view available sections.
The toggle graphic -- ![]() -- indicates an expanding section. Click the toggle or toggle line to view/close expanding sections.
-- indicates an expanding section. Click the toggle or toggle line to view/close expanding sections.
Integrating Census 2010 TIGER Shapefiles, ACS 5-year demographics, Census 2010 demographics and related data.
See related interactive ranking tables:
| • | New York school district demographics: http://proximityone.com/sd_ny.htm. |
| • | New York census tract demographics: http://proximityone.com/ustr0509_ny.htm. |
| • | Census 2010 demographics: http://proximityone.com/cen2010_pl94171.htm |
(all US geography: state, congressional district, county, school district, city/place, metro)
The table presented below provides a summary demographic profile for the state based on the Census 2010 P.L. 94-171 data. Similar to a profile developed by Census, this profile also includes two columns providing characteristics for the population under 18 years of age. These profiles are available for any Census 2010 geography, census block and higher level geography.
ProximityOne -- additional details and interactive ranking table
|
||||||||||||||||||||||||||||||||||||||||||||||||||||||||||||||||||||||||||||||||||||||||||||||||||||||||||||||||||||||||||||||||||||||||||||||||||||||||||||||||||||||||||||||||||||||||||||||||||||||||||
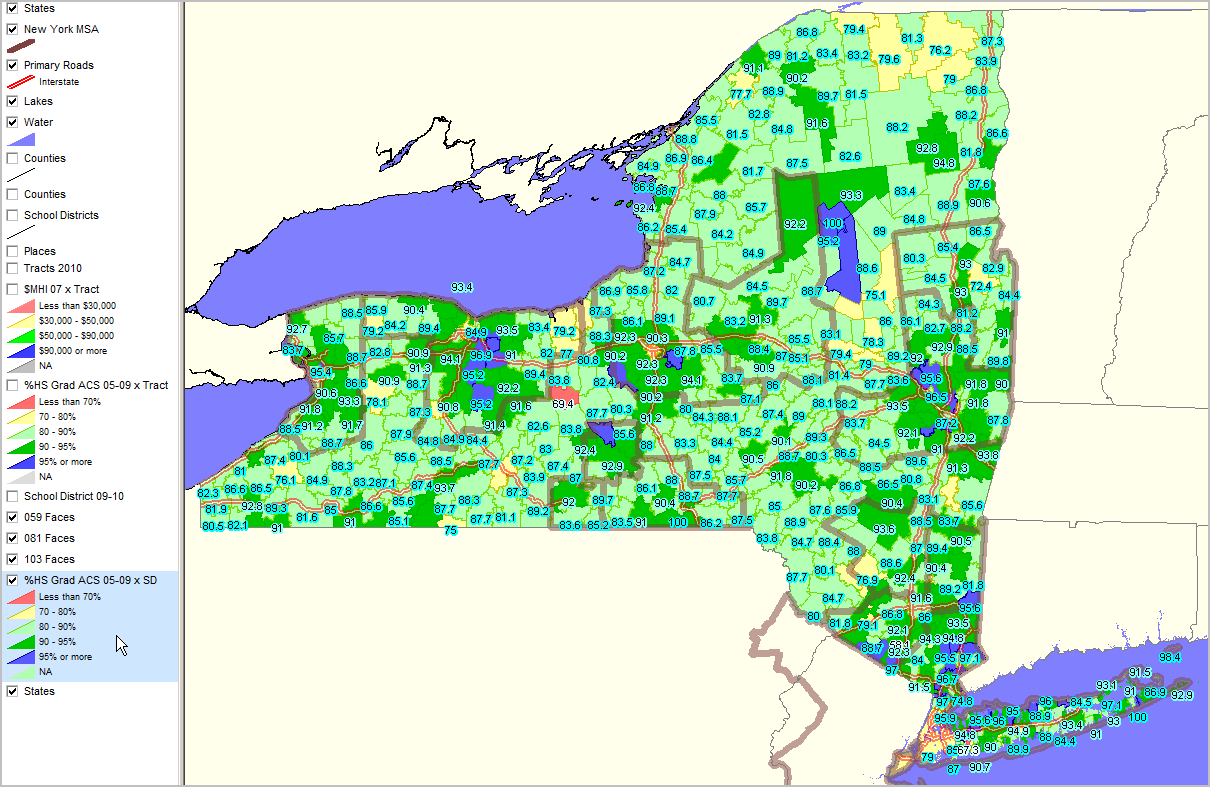
Educational Attainment by School District
Percent high school graduate (population 25 years and over) by school district.
Data based on 2009 American Community Survey (http://proximityone.com/acs.htm) 5-year estimates, centric to mid-2007.
View 1 (see View 2 with counties below View1; View 3 Long Island zoom-in)
New York MSAs shown with bold boundary.
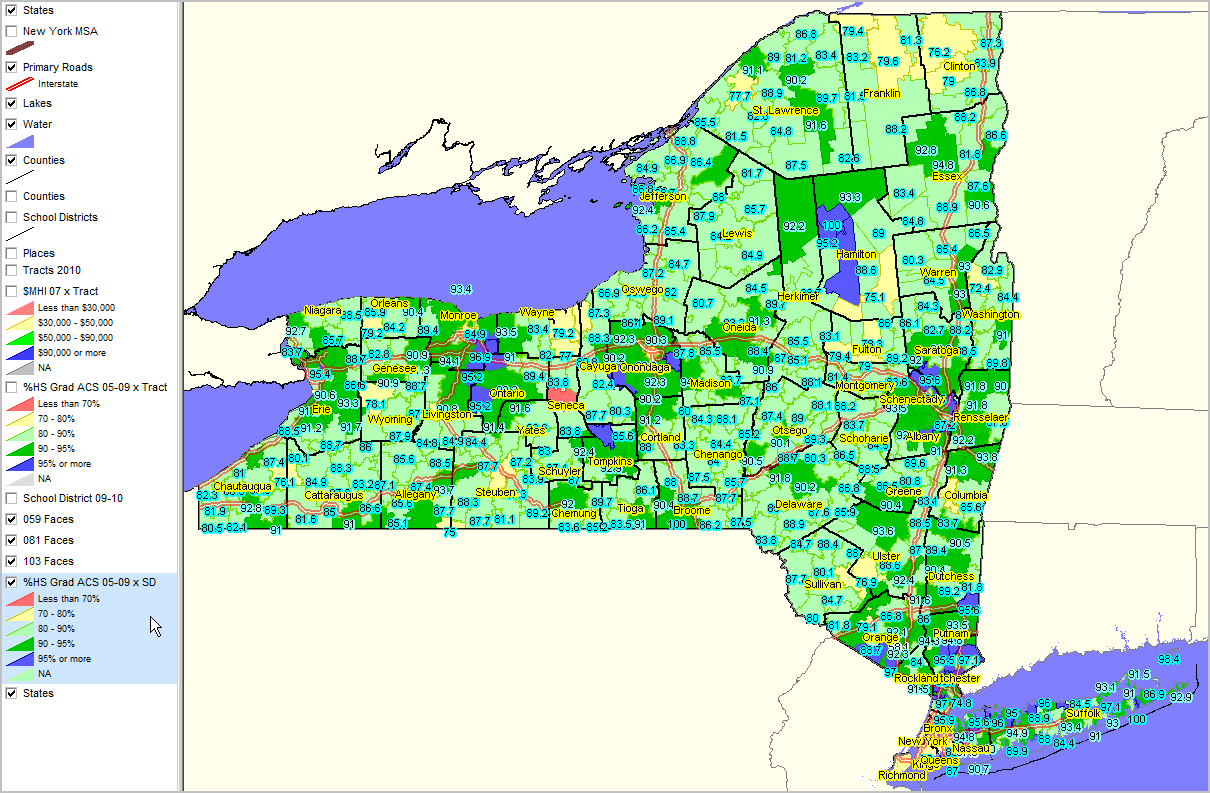
View 2, similar to View 1, with county names
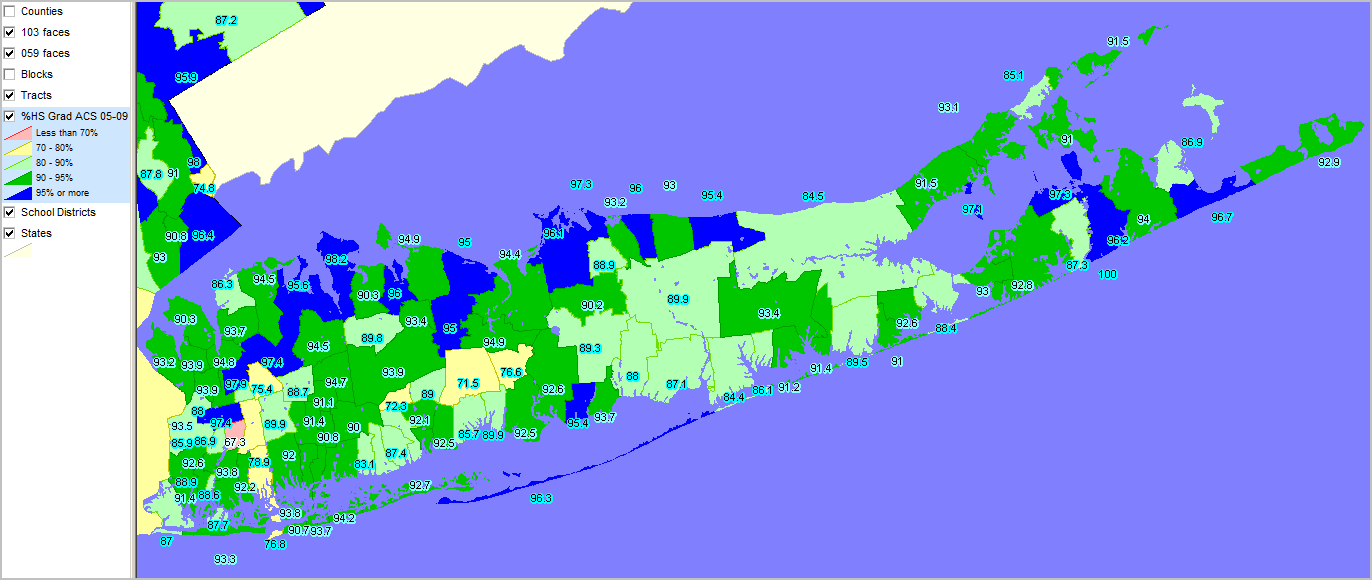
View 3, Long Island Zoom-in
Labels show percent population 25 years and over who are high school graduates.
This view uses "faces" polygons to show perennial water features as water and provide a more detailed depiction of coastal areas. Compare to above view.