|
|
|
School District Revenue & Expenditure Patterns ... in relation to 113th Congressional Districts
U.S. public elementary and education systems, mostly school districts, reported approximately $600 billion in revenues collected in fiscal year 2010. This section shows map graphics developed using the ProximityOne CVXE GIS software focused on school districts in relation to 113th Congressional Districts. The maps show patterns of percent Federal revenue by school district for school districts receiving 12.3 percent (FY 2010 national average) or more of total revenue from Federal sources. See more about school district finances and school district demographic-economic data and analysis. These map/pattern views were developed to support the initiative of the American Association of School Administrators relating to the December 2012 report entitled Federal Public Education Revenues and the Sequester. Contents ... click on area link to view map details • U.S. 113th Congressional Districts & School Districts Selected States & Regions • California • Connecticut • Florida • Kentucky • Ohio • Minnesota-Wisconsin • Washington U.S. 113th Congressional Districts & School Districts -- School District Patterns of Federal Revenue as a Percentage of Total Revenue 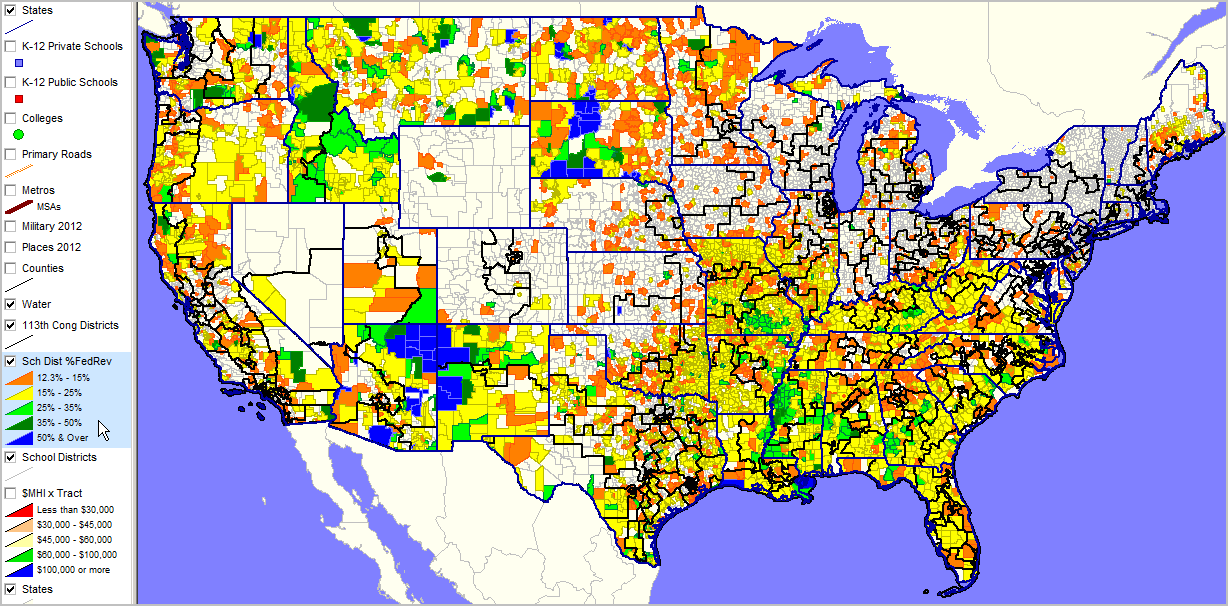
California 113th Congressional Districts & School Districts -- School District Patterns of Federal Revenue as a Percentage of Total Revenue 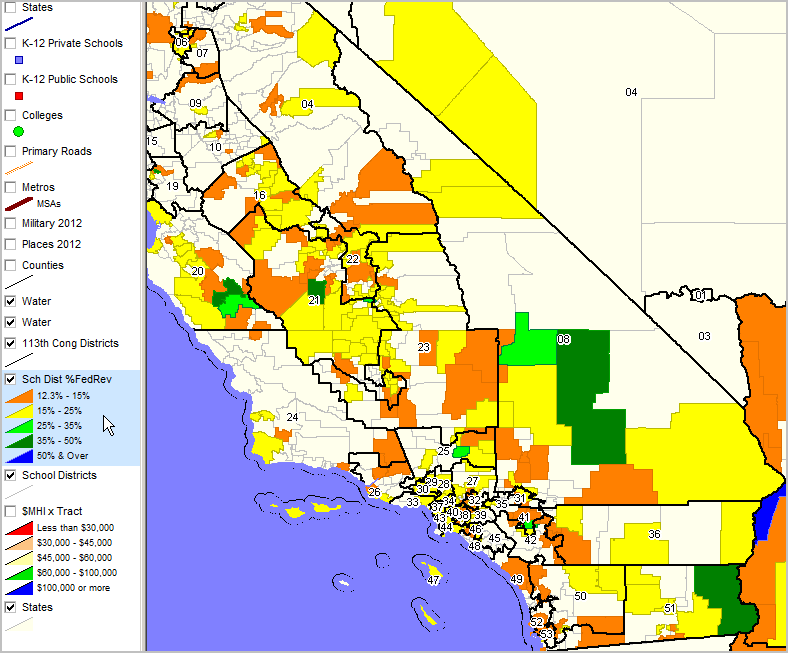
Connecticut 113th Congressional Districts & School Districts -- School District Patterns of Federal Revenue as a Percentage of Total Revenue 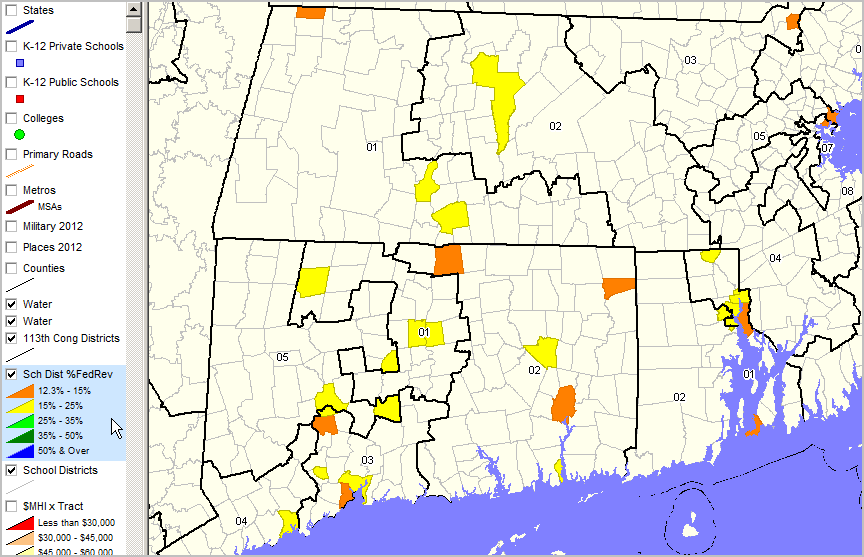
Florida 113th Congressional Districts & School Districts -- School District Patterns of Federal Revenue as a Percentage of Total Revenue 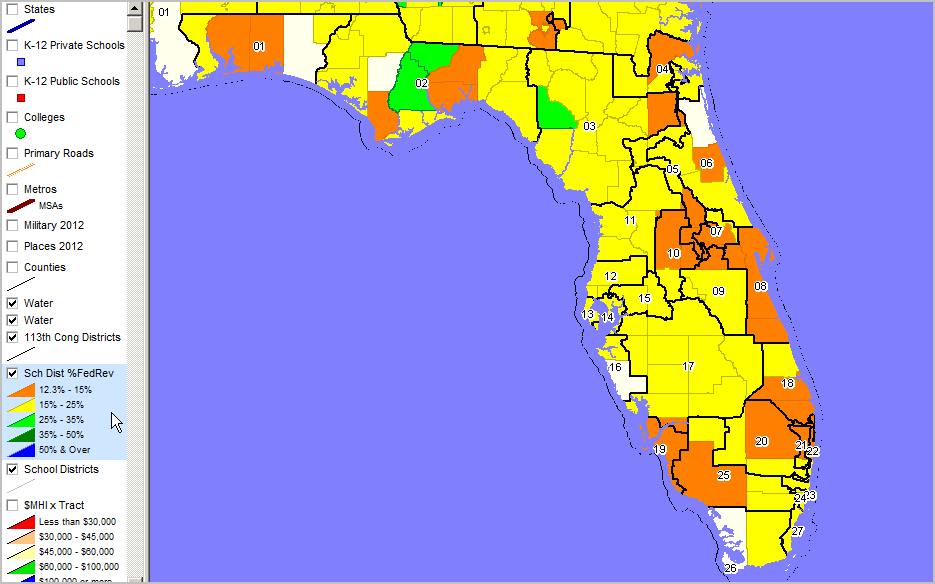
Kentucky 113th Congressional Districts & School Districts -- School District Patterns of Federal Revenue as a Percentage of Total Revenue 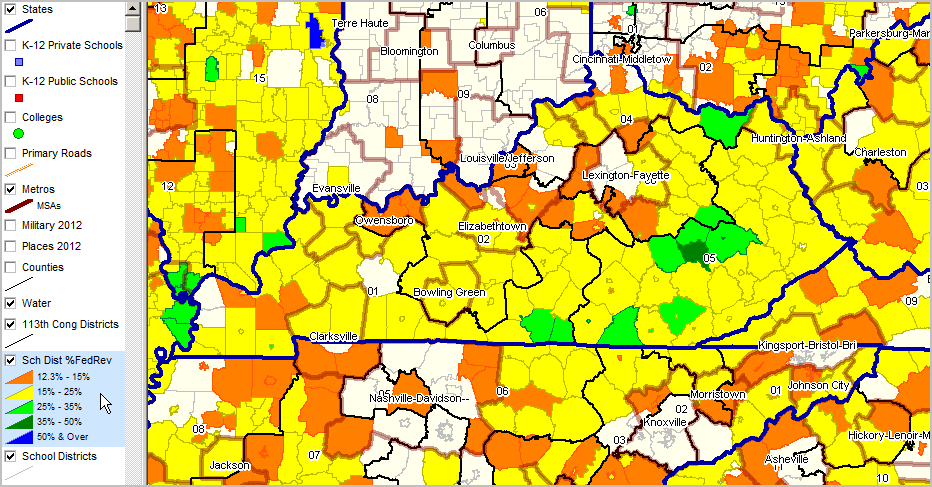
Ohio 113th Congressional Districts & School Districts -- School District Patterns of Federal Revenue as a Percentage of Total Revenue 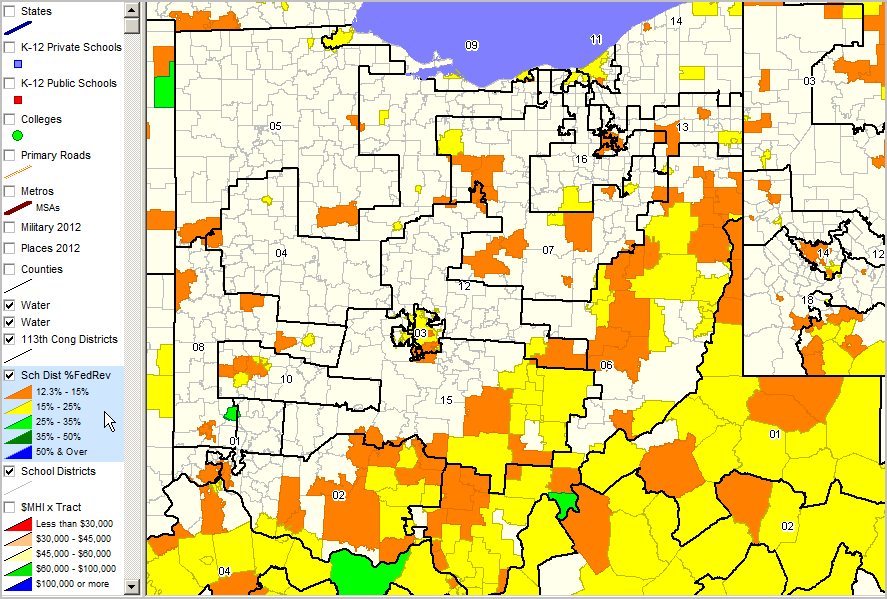
Minnesota-Wisconsin 113th Congressional Districts & School Districts -- School District Patterns of Federal Revenue as a Percentage of Total Revenue 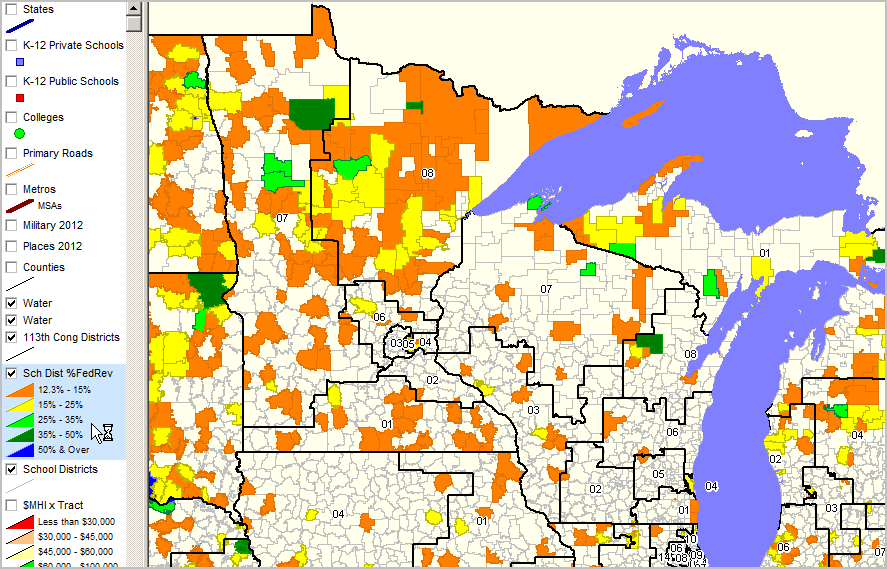
Washington 113th Congressional Districts & School Districts -- School District Patterns of Federal Revenue as a Percentage of Total Revenue 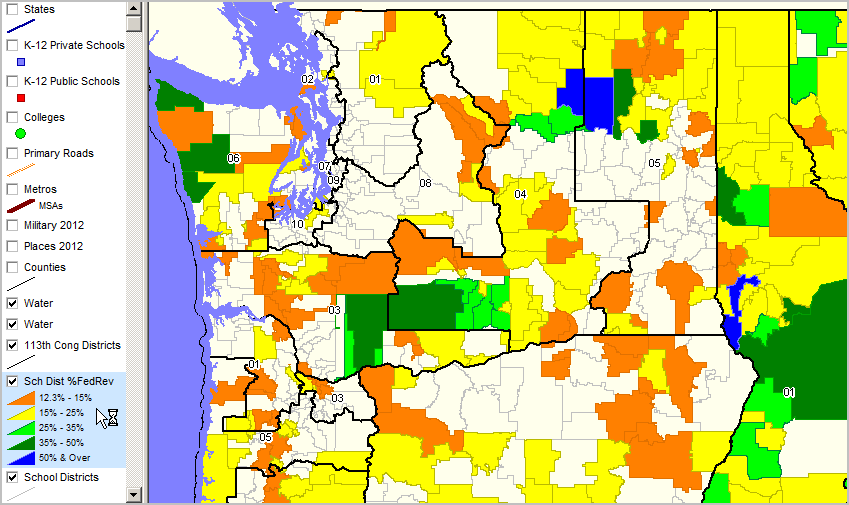
About AASA The American Association of School Administrators, founded in 1865, is the professional organization for more than 13,000 educational leaders in the United States and throughout the world. The mission of AASA is to advocate for the highest quality public education for all students, and develop and support school system leaders. For more information, visit www.aasa.org. Follow AASA on twitter at www.twitter.com/AASAHQ. About ProximityOne ProximityOne develops geographic-demographic-economic data and analytical tools and helps organizations knit together and use diverse data in a decision-making and analytical framework. We develop custom demographic/economic estimates and projections, geographic and geocoded address files and assist with impact and geospatial analyses. Wide-ranging organizations use our tools (software, data, methodologies) to analyze their own data integrated with other data. Follow ProximityOne on Twitter at www.twitter.com/proximityone. Contact ProximityOne (888-364-7656) with questions about data covered in this section or to discuss custom estimates, projections or analyses for your areas of interest. |
|
|