
|
|
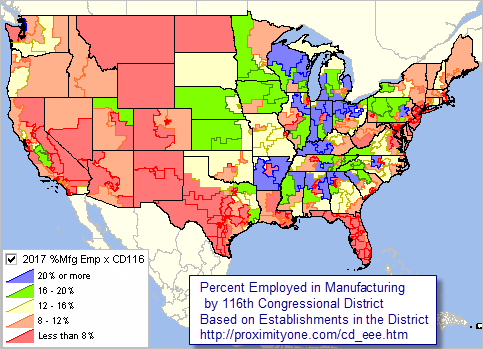
.. examining business establishment characteristics .. establishments, employment & earnings by type of business December 2019 .. business establishments account for roughly 83 percent of the total employment in the United States. The distribution of U.S. business establishments by type of business is shown in the table below. The number and characteristics of business establishments vary widely among congressional districts. Understanding the makeup of business establishments, and how they contribute to the economy and social order, is important to policymakers, businesses, researchers and stakeholders. This section provides insights and access to data and analytical tools to examine characteristics of business establishments by congressional district. The extent and nature of voting participation varies from district to district in large part due to "what's happening" with business establishments in the individual districts. View, rank, compare the business establishment characteristics by congressional district using the interactive table below. Use the corresponding interactive table on the Congressional Districts main page to examine characteristics of incumbents and demographics. Follow and engage in the use of these data and analytical tools as a part of the Congressional Districts/State Legislative District (CDSLD) group. 116th Congressional District Analysis & Insights .. patterns of business establishments .. among all CDs, based on establishments within district: • NY12: highest annual pay for any sector $324,426 (Finance) • CA17: highest annual pay for total establishments $130,243 • TX34: lowest annual pay for total establishments $25,746 • NY12: most employment of any district 1,530,829 • CA21: least employment of any district 109,757 • NY12: most establishments of any district 69,675 • CA21: least establishments of any district 7,047 Patterns of Percent Manufacturing Employment by 116th Congressional District The following graphic shows patterns of 2017 percent manufacturing employment 116th Congressional District. Use GIS tools/data to generate similar views for any state and/or drill-down. Click graphic for larger view with more detail. Expand browser window for best quality view. Larger view shows CD codes.  - view developed using ProximityOne CV XE GIS and related GIS project. Additional views • Southern California U.S. Establishments, Employment, Pay by Sector, 2017 .. goto top
Congressional District Employment, Establishments & Pay by Sector .. interactive table .. goto top Use the buttons & tools below the table for most effective use of this table and data. Table shows rows by congressional districts with business establishment characteristics across columns. Rows are iterated by type of business for each district. Click ShowAll button between Find/Queries. Use mouseover on column header to view column description. See usage notes below table. See related interactive tables. Usage Notes • If table not showing any rows; click ShowAll button below table. • Use vertical and horizontal scroll bars to navigate up/down or left/right. • Adjust column widths using column divider between header cells. GIS, Mapping & Geospatial Analysis The above table is organized as rows corresponding to congressional district iterated by type of business. One way to more effectively map or geospatially analyze congressional district (any type of area) business establishment characteristics is to restructure the hierarchical organization (as in above table) to a flat structure -- one record per district. This makes it easier to geospatially analyze a wide range of business characteristics. .. this section will be updated ... About these Data Data used in this section are based on the Census Bureau 2017 County Business Patterns. Released in November 2019, these data are tabulated annually. These are the only national scope data that provide characteristics of business establishments by congressional district. These data provide a unique annual snapshot on business establishments by type of business sector with related employment and pay data. The utility of these data is enhanced with a similar scope of data also being available for the U.S. and by state, metro, county and ZIP code. Data by type of business are based on the NAICS. Data for congressional districts are tabulated only for total establishments and 2-digit industry level. Data show the number of establishments, employment during the week of March 12, 2017, and annual payroll. The data are extracted from the Census Bureau Business Register (BR), a database of all known single and multi-establishment employer companies maintained and updated by the Census Bureau. These data do not cover the self-employed, public employment and most agricultural employment. Data are not based on a smaple survey; they are tabulated by business location and use a business source to determine industry. Employment data by industry by congressional district are also available from the American Community Survey (ACS). However, the ACS data do not provide establishment or payroll data. Support Using these Resources .. goto top Learn more about accessing and using demographic-economic data and related analytical tools. Join us in a Data Analytics Lab session. There is no fee for these one-hour Web sessions. Each informal session is focused on a specific topic. The open structure also provides for Q&A and discussion of application issues of interest to participants. ProximityOne User Group Join the ProximityOne User Group to keep up-to-date with new developments relating to geographic-demographic-economic decision-making information resources. Receive updates and access to tools and resources available only to members. Use this form to join the User Group. Additional Information ProximityOne develops geographic-demographic-economic data and analytical tools and helps organizations knit together and use diverse data in a decision-making and analytical framework. We develop custom demographic/economic estimates and projections, develop geographic and geocoded address files, and assist with impact and geospatial analyses. Wide-ranging organizations use our tools (software, data, methodologies) to analyze their own data integrated with other data. Follow ProximityOne on Twitter at www.twitter.com/proximityone. Contact ProximityOne (888-364-7656) with questions about data covered in this section or to discuss custom estimates, projections or analyses for your areas of interest. |
|
|