
|
|
|
|
State Legislative District Data Analytics -- ACS 2014 Housing Characteristics
January 2016. The importance of understanding the demographic-economic make-up and patterns for state legislative districts can hardly be overstated. Community and neighborhood challenges and opportunities are shaped by demographic-economic dynamics. Legislative district incumbents and stakeholders need this information to assess conditions and plan to meet the needs of residents. Only by knowing "where we are" can we develop the most effective plans for improvement. Use the GIS project to examine state legislative districts in context of neighborhoods and small area socioeconomic patterns (details below). Housing Characteristics State legislative districts are diverse; they range in median housing value from $33,100 to more than $1,000,000. The median monthly rent ranges from $344 to more than $2,000. Use the interactive table below to view other economic characteristics. Compare districts of interest. .. related sections: General Demographics.. Social .. Economic characteristics. New York Metro House Districts & Economic Prosperity by ZIP Code Illustrative GIS application showing legislative districts contextually with other geography & subject matter. House districts black boundary & district code; patterns of median household income by ZIP code. 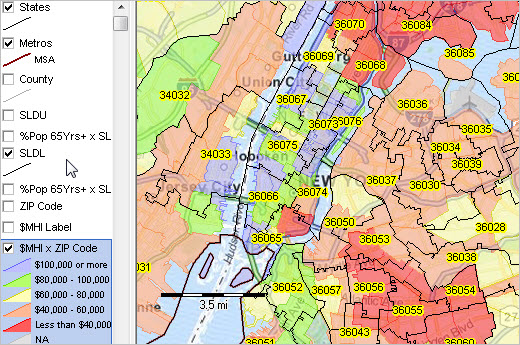 - View developed using CV XE GIS and related GIS project. - see below in this section about using this GIS project. This section is focused on tools, resources and methods that you can use to access, integrate and analyze state legislative district general demographics data. The U.S. national scope ACS 2014 (released December 2015) State Legislative District Demographic-Economic Dataset contains approximately 600 subject matter items tabulated for each state legislative district organized into four subject matter groups: • General Demographics • Social Characteristics • Economic Characteristics • Housing Characteristics -- this section See more about the importance of these data. Data reviewed in this section are based on the American Community Survey (ACS) 2014 5-year estimates for state legislative districts defined as of the 2014 legislative session. See notes on importance of these data. See similar ranking tables for: Congressional Districts | Census Tracts | ZIP Codes | State, Metro & County. Texas State Legislative Districts -- Upper Patterns of percent population age 65 years and over by upper/senate legislative district. Metros shown with red-brown boundary. 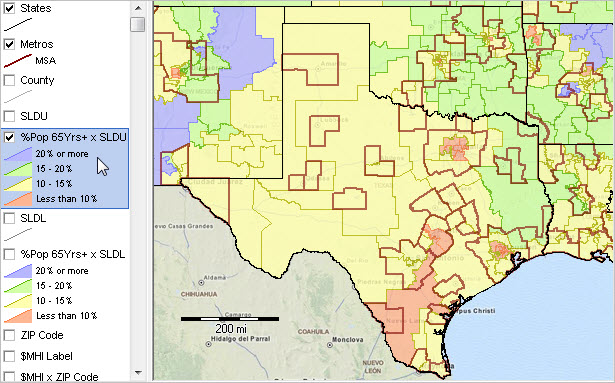 - View developed using CV XE GIS and related GIS project. Texas State Legislative Districts -- Lower Patterns of percent population age 65 years and over by lower/house legislative district. Metros shown with red-brown boundary. 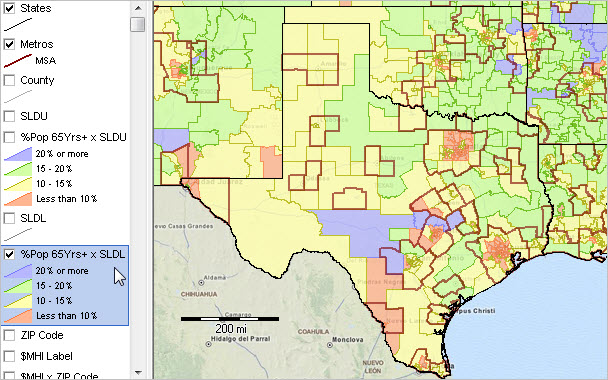 - View developed using CV XE GIS and related GIS project. Get a Custom Map for Your State of Interest Use this form to request a no fee map graphic similar to the one shown above for a state of interest. Enter the request with state name in the text section; e.g., "Requesting state legislative district %population 65 years & over for Illinois SLDL." Using the Interactive Table Use the interactive ranking table in this section to view, query, rank, compare housing characteristics of the population, households and families for these areas. The scroll box shown below lists each of the subject matter items available for each area via the ranking table. In the subject matter items scroll box, subject matter items are organized into to mini-tables with related items. The number at the left of the subject matter item is also used as the short name for the subject matter item in the column header in the ranking table. Housing Characteristics Items
HOUSING OCCUPANCY
H001 Total housing units H002 Occupied housing units H003 Vacant housing units H004 Homeowner vacancy rate H005 Rental vacancy rate UNITS IN STRUCTURE H006 Total housing units H007 1-unit, detached H008 1-unit, attached H009 2 units H010 3 or 4 units H011 5 to 9 units H012 10 to 19 units H013 20 or more units H014 Mobile home H015 Boat, RV, van, etc. YEAR STRUCTURE BUILT H016 Total housing units H017 Built 2010 or later H018 Built 2000 to 2009 H019 Built 1990 to 1999 H020 Built 1980 to 1989 H021 Built 1970 to 1979 H022 Built 1960 to 1969 H023 Built 1950 to 1959 H024 Built 1940 to 1949 H025 Built 1939 or earlier ROOMS H026 Total housing units H027 1 room H028 2 rooms H029 3 rooms H030 4 rooms H031 5 rooms H032 6 rooms H033 7 rooms H034 8 rooms H035 9 rooms or more H036 Median rooms BEDROOMS H037 Total housing units H038 No bedroom H039 1 bedroom H040 2 bedrooms H041 3 bedrooms H042 4 bedrooms H043 5 or more bedrooms HOUSING TENURE H044 Occupied housing units H045 Owner-occupied H046 Renter-occupied H047 Average household size of owner-occupied unit H048 Average household size of renter-occupied unit YEAR HOUSEHOLDER MOVED INTO UNIT H049 Occupied housing units H050 Moved in 2010 or later H051 Moved in 2000 to 2009 H052 Moved in 1990 to 1999 H053 Moved in 1980 to 1989 H054 Moved in 1970 to 1979 H055 Moved in 1969 or earlier VEHICLES AVAILABLE H056 Occupied housing units H057 No vehicles available H058 1 vehicle available H059 2 vehicles available H060 3 or more vehicles available HOUSE HEATING FUEL H061 Occupied housing units H062 Utility gas H063 Bottled, tank, or LP gas H064 Electricity H065 Fuel oil, kerosene, etc. H066 Coal or coke H067 Wood H068 Solar energy H069 Other fuel H070 No fuel used SELECTED CHARACTERISTICS H071 Occupied housing units H072 Lacking complete plumbing facilities H073 Lacking complete kitchen facilities H074 No telephone service available OCCUPANTS PER ROOM H075 Occupied housing units H076 1.00 or less H077 1.01 to 1.50 H078 1.51 or more VALUE H079 Owner-occupied units H080 Less than $50,000 H081 $50,000 to $99,999 H082 $100,000 to $149,999 H083 $150,000 to $199,999 H084 $200,000 to $299,999 H085 $300,000 to $499,999 H086 $500,000 to $999,999 H087 $1,000,000 or more H088 Median (dollars) MORTGAGE STATUS H089 Owner-occupied units H090 Housing units with a mortgage H091 Housing units without a mortgage SELECTED MONTHLY OWNER COSTS (SMOC) H092 Housing units with a mortgage H093 Less than $300 H094 $300 to $499 H095 $500 to $699 H096 $700 to $999 H097 $1,000 to $1,499 H098 $1,500 to $1,999 H099 $2,000 or more H100 Median (dollars) H101 Housing units without a mortgage H102 Less than $100 H103 $100 to $199 H104 $200 to $299 H105 $300 to $399 H106 $400 or more H107 Median (dollars) SELECTED MONTHLY OWNER COSTS AS A PERCENTAGE OF HOUSEHOLD INCOME (SMOCAPI) H108 Housing units with a mortgage (excluding units where SMOCAPI cannot be computed) H109 Less than 20.0 percent H110 20.0 to 24.9 percent H111 25.0 to 29.9 percent H112 30.0 to 34.9 percent H113 35.0 percent or more H114 Not computed H115 Housing unit without a mortgage (excluding units where SMOCAPI cannot be computed) H116 Less than 10.0 percent H117 10.0 to 14.9 percent H118 15.0 to 19.9 percent H119 20.0 to 24.9 percent H120 25.0 to 29.9 percent H121 30.0 to 34.9 percent H122 35.0 percent or more H123 Not computed GROSS RENT H124 Occupied units paying rent H125 Less than $200 H126 $200 to $299 H127 $300 to $499 H128 $500 to $749 H129 $750 to $999 H130 $1,000 to $1,499 H131 $1,500 or more H132 Median (dollars) H133 No rent paid GROSS RENT AS A PERCENTAGE OF HOUSEHOLD INCOME (GRAPI) H134 Occupied units paying rent (excluding units where GRAPI cannot be computed) H135 Less than 15.0 percent H136 15.0 to 19.9 percent H137 20.0 to 24.9 percent H138 25.0 to 29.9 percent H139 30.0 to 34.9 percent H140 35.0 percent or more H141 Not computed State Legislative District ACS 2014 Interactive Tables -- Housing Characteristics Click ShowAll button between Find/Queries. Use mouseover on column header to view column description. See usage notes below table. See related tables -- http://proximityone.com/rankingtables.htm. Usage Notes • If table not showing any rows; click ShowAll button below table. • Use vertical and horizontal scroll bars to navigate up/down or left/right. • Adjust column widths using column divider between header cells. • Type> -- use to select Upper/Senate (610) or Lower/House (620) • Find Name> button -- use to select district based on exact spelling of partial name in column 1. .. Key in exact up/low case spelling of partial name of district in the edit box to right of Find Name> button. .. overwriting the value Los Angeles. .. click the Find Name> button ... table refreshes with all districts with matched spelling in column 1. • Selected columns -- click the "Units.Occ.Vacant.%MdValue.$MdRent" button to show only these columns; .. click "All columns" button to restore view to all columns. • All items are estimates centric to mid-2012. • Click ShowAll button between specific area queries. • Cells with -1 value could not be estimated (for this geography and this time frame). State Legislative Districts GIS Project/Datasets 1. Install the ProximityOne CV XE GIS ... omit this step if CV XE GIS software already installed. ... run the CV XE GIS installer ... take all defaults during installation 2. Download the State Legislative Districts GIS Project fileset ... requires ProximityOne User Group ID (join now) ... unzip State Legislative Districts GIS project files to local folder State Legislative Districts GIS Project 3. Open the sld2014b.gis project ... after completing the above steps, click File>Open>Dialog ... open the file named C:\sld2014\sld2014b.gis 4. Done .. the start-up view is similar to Texas SLD graphic shown above. GIS Layers The GIS project includes these layers/shapefiles/datasets: 1. U.S. by state 2. U.S. by CBSA/Metro - set to MSA only at start-up 3. U.S. by County - check layer checkbox in legend to show in map window 4. Texas Primary and Secondary Roads - set to Interstate only at start-up; names as labels optionally turned on 5. Houston Super Neighborhoods (SNBR) - check layer checkbox in legend to show in map window The following graphic shows the SNBRs in context of patterns of economic prosperity (median household income) by ZIP code area. Use the GIS project to examine relationships between neighborhoods and state legislative districts. Click graphic for larger view (expand browser window for best quality view).  6. Texas State Legislative Districts - Upper with integrated DP1 demographics 7. Texas State Legislative Districts - Lower with integrated DP1 demographics 8. Texas ZIP Code Area with integrated selected demographic-economic items - initially set to patterns of median household income 9. MapQuest OpenStreetMaps Need assistance using any aspect of these tools or data? Join us in a Data Analytics Lab session. There is no fee for these one-hour Web sessions. State Legislative Districts State legislative districts are the areas from which members are elected to state or equivalent entity legislatures. State legislative districts are comprised of upper (senate) and lower (house) chambers. Nebraska has a unicameral legislature and the District of Columbia has a single council; these are treated as upper-chamber legislative areas in the interactive table. Importance of State Legislative District Demographic-Economic Data The American Community Survey provides "richer" demographic-economic characteristics for national scope 2014 session state legislative districts. Only ACS sourced data provide details on topics such as income and poverty, labor force and employment, housing value and costs, educational participation and attainment, language spoken at home, among many related items. The approximate 600 items accessible via the dataset are supplemented by a wide range of additional subject matter. ProximityOne User Group Join the ProximityOne User Group to keep up-to-date with new developments relating to metros and component geography decision-making information resources. Receive updates and access to tools and resources available only to members. Use this form to join the User Group. Support Using these Resources Learn more about accessing and using demographic-economic data and related analytical tools. Join us in a Data Analytics Lab session. There is no fee for these one-hour Web sessions. Each informal session is focused on a specific topic. The open structure also provides for Q&A and discussion of application issues of interest to participants. Additional Information ProximityOne develops geodemographic-economic data and analytical tools and helps organizations knit together and use diverse data in a decision-making and analytical framework. We develop custom demographic/economic estimates and projections, develop geographic and geocoded address files, and assist with impact and geospatial analyses. Wide-ranging organizations use our tools (software, data, methodologies) to analyze their own data integrated with other data. Follow ProximityOne on Twitter at www.twitter.com/proximityone. Contact us (888-364-7656) with questions about data covered in this section or to discuss custom estimates, projections or analyses for your areas of interest. |
|
|