
|
|
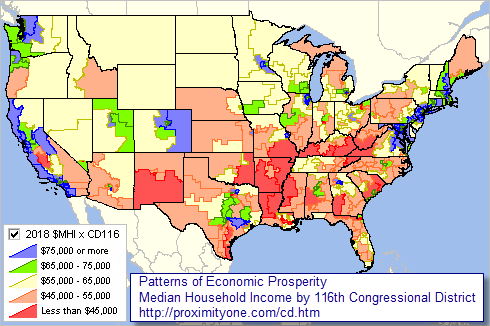
.. examining patterns of median household income October 2020 .. median household income is one measure of economic prosperity. This section reviews patterns of median household income (MHI) by 116th Congressional Districts based on the 2019 American Community Survey 1-year estimates (ACS 2019). View, rank, compare the MHI by congressional district, among related demographic attributes using the interactive table on the main Congressional Districts page. Here we cover methods and steps to access, integrate and analyze demographic-economic characteristics of congressional districts. Operations assume make use of a Windows PC with Internet access, Notepad and Excel. Accessing $MHI by Congressional District .. building a data file using API tools .. join us in a Data Analytics Web Session to see how to perform these steps. Use API tools to develop a CSV file containing the ACS 2019 population and median household income for each congressional district. 1. Click this link to access these data: https://api.census.gov/data/2019/acs/acs1?get=NAME,B01001_001E,B19013_001E&for=congressional%20district:* Clicking the above link returns a new page with data displayed in a "CSV-like" structure. 2. Viewing the data page displayed in step 1, click Ctrl-A (select all) then Ctrl-C (copy to clipboard). 3. Start Notepad and click Ctrl-V on a new, empty Notepad page. 4. Remove the "[" and "]" using the Notepad Edit feature. Remove all of these characters. 5. Use the Notepad File>Save as feature to save this file in "This PC > Documents" .. use the new file name CD_MHI.CSV 6. Start Excel. Select File>New then Data>from CSV. At the dialog prompt, open "This PC > Documents" .. file name CD_MHI.CSV. Save the file as "This PC > Documents" .. file name CD_MHI.XLS. 7. The process is complete, you now have the ACS 2019 1 year estimates of population and median household income in an Excel file. Use the file/data to achieve your anlaytical objective. More About 116th Congressional District Analysis & Insights .. patterns of household income & economic prosperity: Based on the ACS 2018 median household income (MHI): • the MHI among all districts was $60,291 • the U.S. overall MHI was $61,937 As of November 2019: • the 19 districts with highest MHI have Democrat incumbents • the 10 districts with the highest Gini Index have Democrat incumbents • there are 69 Republican incumbent districts above the all districts MHI • there are 149 Democrat incumbent districts above the all districts MHI • the MHI of the 236 Democrat incumbent districts is $66,829 • the MHI of the 199 Republican incumbent districts is $56,505 Median household income is only one measure of economic prosperity. See more at http://proximityone.com/cd.htm. Patterns of Economic Prosperity 116th Congressional District The following graphic shows patterns of 2018 median household income by 116th Congressional District. Use GIS tools/data to generate similar views for any state and/or drill-down. Click graphic for larger view with more detail. Expand browser window for best quality view.  - view developed using ProximityOne CV XE GIS and related GIS project. About this Section .. goto top Follow our monthly reviews on Congressional District demographic, social, economic and housing topics .. updates are posted in the CDSLD Group digest section; participants are notified by e-mail .. join now; no fee. Support Using these Resources .. goto top Learn more about accessing and using demographic-economic data and related analytical tools. Join us in a Data Analytics Lab session. There is no fee for these one-hour Web sessions. Each informal session is focused on a specific topic. The open structure also provides for Q&A and discussion of application issues of interest to participants. ProximityOne User Group Join the ProximityOne User Group to keep up-to-date with new developments relating to geographic-demographic-economic decision-making information resources. Receive updates and access to tools and resources available only to members. Use this form to join the User Group. Additional Information ProximityOne develops geographic-demographic-economic data and analytical tools and helps organizations knit together and use diverse data in a decision-making and analytical framework. We develop custom demographic/economic estimates and projections, develop geographic and geocoded address files, and assist with impact and geospatial analyses. Wide-ranging organizations use our tools (software, data, methodologies) to analyze their own data integrated with other data. Follow ProximityOne on Twitter at www.twitter.com/proximityone. Contact ProximityOne (888-364-7656) with questions about data covered in this section or to discuss custom estimates, projections or analyses for your areas of interest. |
|
|