
|
|
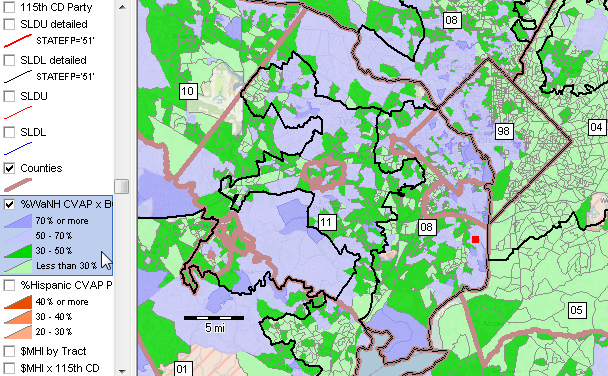
115th Congressional Districts February 2018. The Citizen Voting Age Population (CVAP) is important for many reasons. As suggested by the name, this is the core population group eligible to vote in elections. Registered voters are a subset of this group; actual voters are a further subset of this group. From an individual or party election management, strategy perspective, it is important to understand where prospective voters are located (the CVAP population) .. and how the distribution and magnitude of the CVAP population differs from the total population and registered voter population. Knowing about the CVAP population is also important to government election operations that manage voting precincts. We can learn about these measures using the annually updated CVAP estimates developed by the Census Bureau. This section reviews tools and resources to access and analyze Citizen Voting Age Population by 115th Congressional District. These data are derived from the 2016 American Community Survey (ACS) 5-year estimates Citizen Voting Age Population (CVAP) Special Tabulation. The ACS 2016 CVAP data are provided for these geographic levels: • U.S., State & County .. see interactive table in this related section • 115th Congressional Districts .. see interactive table in this section -- new for with 2016 release • State Legislative District; 2016 cycle .. see interactive table in this related section -- new for with 2016 release • City/Place .. see interactive table in this related section • MCD (Minor Civil Division for selected states) • Census Tract -- available a XLS/CSV/DBF file • Block Group -- available a XLS/CSV/DBF file Citizen Voting Age Population New Citizen Voting Age Population (CVAP) data released in February 2018 marks the 8th release of CVAP estimates based on the American Community Survey (ACS) 5-year estimates. The ACS 2016 estimates are expanded in geographic scope. Going forward, annually updated sections for each new ACS CVAP special tabulation release will be developed similar to this section. The 9th update based on ACS 2017 will be released in February 2019. Patterns of CVAP Population by Block Group See legend in lower right of graphic for interval/color correspondence. Click graphic for larger view; expand browser window for best quality view.  .. view developed with ProximityOne CV XE GIS and related GIS project. The size, characteristics and distribution of the citizen voting age population by block group is very important. • Block groups are the most granular geography at which we can study these demographics. • The size of the citizen voting age population ultimately determines election outcomes. • See illustrative view below of a selected block group and citizen/CVAP attributes by population group. For the 217,479 block groups covering the U.S. wall-to-wall, the median citizen population value is 1,165 (291.8 million population) and the median citizen voting age population is 885 (220 million population). The median total population is 1,252 (314 million population). These data are based on the 2014 American Community Survey ACS 2014 CVAP special tabulation completed in early 2016. WHile the focus here is on the total population, the same scope of data is integrated into the shapefiles Using GIS Resources; Obtaining Custom Maps & Analyses Contact us (or call 888.364.7656) for maps and analyses for areas of interest or to use the integrated, ready-to-use, national scope GIS software, GIS project and datasets. Add your own data; create custom views. CVAP Estimates The ACS 2016 CVAP documentation describes the original file structure and record content. The items estimated are: • TotPop .. total number of people (not available for tracts or block groups) • Pop18+ .. total number of people 18 years of age or older (not available for tracts or block groups) • CitPop .. total number of U.S. citizens • CVAP .. total number of U.S. citizens 18 years of age or older The margin of error estimates is included for each of the above estimates. CVAP Race/Ethnicity Iterations The above estimates are tabulated for 13 race/origin population groups:
Citizen Voting Age Population & Related Measure -- interactive table -- ACS 2016 115th Congressional Districts In the table shown below, there is one row for the each 115th Congressional District. There are 13 sets of subject matter columns corresponding to the above race/origin groups in each row. Each of the 13 sets includes the 4 estimates (TotPop, Pop18+, CitPop, CVAP) listed above plus %CVAP/TotPop for that group. Access/view any of the 13 sets using the corresponding button below the table. Click column header to sort; click again to sort other direction. See related interactive tables Table Notes and Usage Statistical Data from American Community Survey 2016 5-year estimates (ACS1216). Operations: • Click ShowAll button between queries. Related CVAP Sections • Census Tracts; ACS 2009-13 special tabulation • Census Tracts; ACS 2009-13 special tabulation - Hispanic focus • Tracts & Congressional Districts; ACS 2009-13 special tabulation Support Using these Resources [goto top] Learn more about demographic economic data and related analytical tools. Join us in a Data Analytics Lab session. There is no fee for these Web sessions. Each informal session is focused on a specific topic. The open structure also provides for Q&A and discussion of application issues of interest to participants. ProximityOne User Group [goto top] Join the ProximityOne User Group to keep up-to-date with new developments relating to geographic-demographic-economic decision-making information resources. Receive updates and access to tools and resources available only to members. Use this form to join the User Group. Additional Information ProximityOne develops geodemographic-economic data and analytical tools and helps organizations knit together and use diverse data in a decision-making and analytical framework. We develop custom demographic/economic estimates and projections, develop geographic and geocoded address files, and assist with impact and geospatial analyses. Wide-ranging organizations use our tools (software, data, methodologies) to analyze their own data integrated with other data. Follow ProximityOne on Twitter at www.twitter.com/proximityone. Contact us (888-364-7656) with questions about data covered in this section or to discuss custom estimates, projections or analyses for your areas of interest. |
|
|