
|
|
|
-- examining Hispanic citizen voting age population by neighborhood .. a good place to start finding an answer to this question is to use the Hispanic citizen voting age population (CVAP) data. We take a look at using those data here. You can use these same tools and data to examine areas of interest. This section is focused on using census tract level CVAP data. Census tracts cover the U.S. wall-to-wall with well-defined boundaries and average 4,000 population. The approximate 73,500 census tracts offer a good granularity to examine citizen voting age population for neighborhoods and sections of cities or counties. Related CVAP Sections • Block Groups; ACS 2010-14 special tabulation • Census Tracts; ACS 2009-13 special tabulation • Tracts & Congressional Districts; ACS 2009-13 special tabulation %Hispanic CVAP by Census Tract; Houston Area -- in context of Texas 114th Congressional District 29 (black boundary) 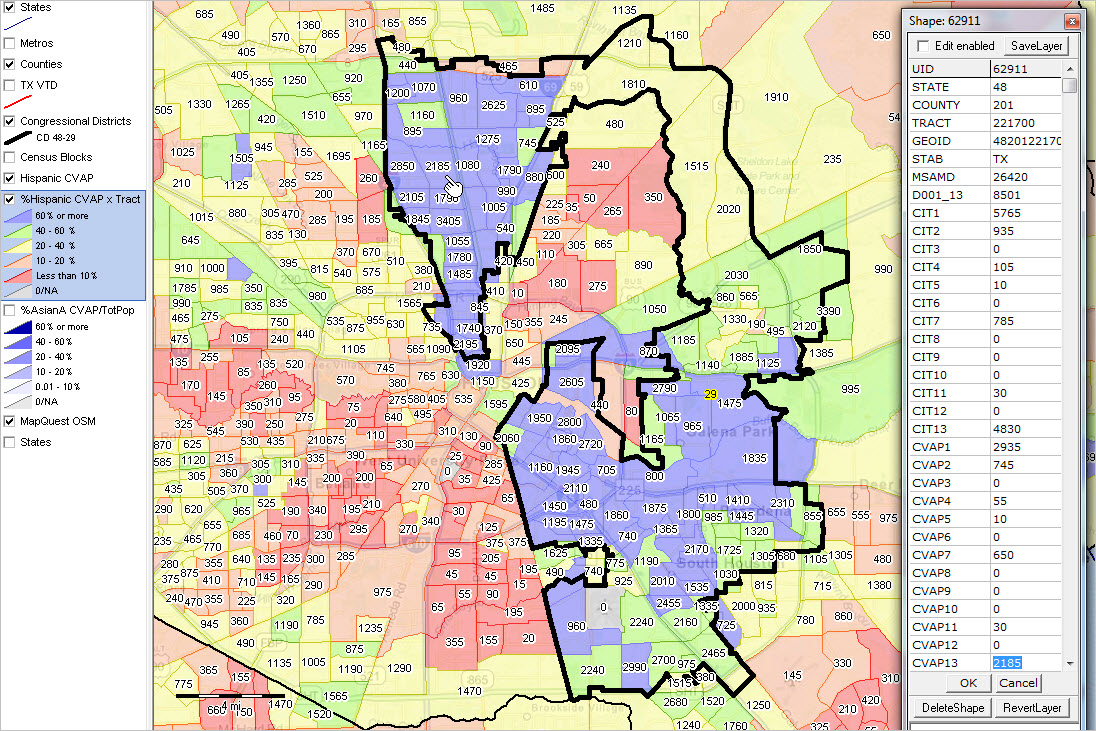 .. view developed with ProximityOne CV XE GIS and related GIS project. This map shows how Texas 114th CD 29 has many census tracts that have high concentrations and percent of Hispanic CVAP (see legend at lower right in graphic). It is easy to where the Latino vote potential is by tract throughout the central Houston area. Develop thematic map patterns like this for any area of the U.S. Optionally link in voting districts/precincts, state legislative districts among many others. Modify appearance with different colors, interval/color assignments, labels among other settings. CVAP data are available for several types of geographic areas (states, counties, census tracts, block groups, among others) from the annually updated American Community Survey (ACS) CVAP special tabulation. Using the Interactive Table Use the interactive table in this related section to analyze patterns among census tracts where numbers and percent of Hispanic CVAP are large. Follow these steps to analyze pattern in the central Houston: • Click ShowAll button below table (resets table). • Click CountyFIPS button below table. - refreshes table with only tracts in county 48201 (Harris County/Houston). • Click Hispanic button below table at far right. - refreshes table with same rows but now selected columns. • Click the "CVAP Hispanic" column header twice. - sorts in descending order; view now appears as: 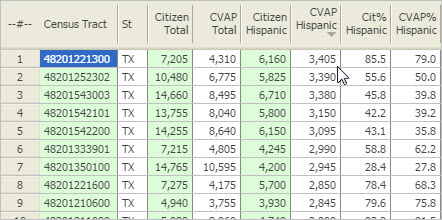 Tract 48201221300 has the highest Hispanic CVAP population (3,405) among all tracts in Harris County (48201). This tract is shown in the map below (see pointer; a zoom in to the map shown above. The tract is labeled with the tract code and the Hispanic CVAP population (3,405). 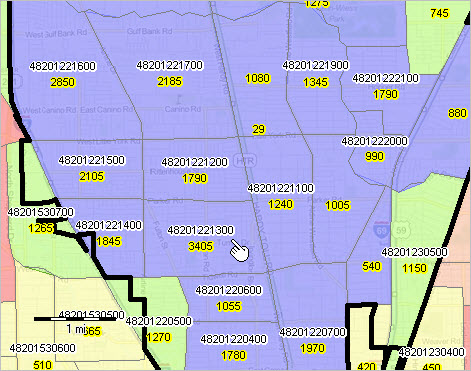 Apply these same methods to any area in the U.S. to determine those census tracts having the highest Hispanic CVAP and the *potential* to have a relatively large Latino Vote in the 2016 Elections. Join me in a Data Analytics Lab session to discuss more details about analyzing characteristics of the citizen voting age population. Learn more about using these data for areas and applications of interest. About the Author -- Warren Glimpse is former senior Census Bureau statistician responsible for innovative data access and use operations. He is also the former associate director of the U.S. Office of Federal Statistical Policy and Standards for data access and use. He has more than 20 years of experience in the private sector developing data resources and tools for integration and analysis of geographic, demographic, economic and business data. Contact Warren. Join Warren on LinkedIn. =========================================== Citizen Voting Age Population by Census Tract: ACS 2009-13 Interactive Table See related Ranking Tables Main Page Usage: click column header to sort; click again to sort other direction. Column Headers; Subject Matter Items All special tabulation estimates are based on survey respondent data collected 2009-2013 and are centric to mid-201.
geoid -- Census 2010 census tract code SS-CCC-TTTTTT
state -- state postal abbreviation Citizen Population citizens - total population citizens - Not Hispanic or Latino (NH) citizens - American Indian or Alaska Native Alone (NH) citizens - Asian Alone (NH) citizens - Black or African American Alone (NH) citizens - Native Hawaiian or Other Pacific Islander Alone (NH) citizens - White Alone (NH) citizens - American Indian or Alaska Native and White (NH) citizens - Asian and White (NH) citizens - Black or African American and White (NH) citizens - American Indian or Alaska Native and Black or African American (NH) citizens - Remainder of Two or More Race Races (NH) citizens - Hispanic or Latino Citizen Voting Age Population voting age citizens - total population voting age citizens - Not Hispanic or Latino (NH) voting age citizens - American Indian or Alaska Native Alone (NH) voting age citizens - Asian Alone (NH) voting age citizens - Black or African American Alone (NH) voting age citizens - Native Hawaiian or Other Pacific Islander Alone (NH) voting age citizens - White Alone (NH) voting age citizens - American Indian or Alaska Native and White (NH) voting age citizens - Asian and White (NH) voting age citizens - Black or African American and White (NH) voting age citizens - American Indian or Alaska Native and Black or African American (NH) voting age citizens - Remainder of Two or More Race Responses (NH) voting age citizens - Hispanic or Latino Citizen Population - Percent total citizen population - percent of citizen population Not Hispanic or Latino (NH) - citizen population - percent of citizen population American Indian or Alaska Native Alone (NH) - citizen population - percent of citizen population Asian Alone (NH) - citizen population - percent of citizen population Black or African American Alone (NH) - citizen population - percent of citizen population Native Hawaiian or Other Pacific Islander Alone (NH) - citizen population - percent of citizen population White Alone (NH) - citizen population - percent of citizen population American Indian or Alaska Native and White (NH) - citizen population - percent of citizen population Asian and White (NH) - citizen population - percent of citizen population Black or African American and White (NH) - citizen population - percent of citizen population American Indian or Alaska Native and Black or African American (NH) - citizen population - percent of citizen population Remainder of Two or More Race Races (NH) - citizen population - percent of citizen population Hispanic or Latino - citizen population - percent of citizen population Citizen Voting Age Population -- Percent total CVAP population - percent of CVAP population Not Hispanic or Latino (NH) - CVAP population - percent of CVAP population American Indian or Alaska Native Alone (NH) - CVAP population - percent of CVAP population Asian Alone (NH) - CVAP population - percent of CVAP population Black or African American Alone (NH) - CVAP population - percent of CVAP population Native Hawaiian or Other Pacific Islander Alone (NH) - CVAP population - percent of CVAP population White Alone (NH) - CVAP population - percent of CVAP population American Indian or Alaska Native and White (NH) - CVAP population - percent of CVAP population Asian and White (NH) - CVAP population - percent of CVAP population Black or African American and White (NH) - CVAP population - percent of CVAP population American Indian or Alaska Native and Black or African American (NH) - CVAP population - percent of CVAP population Remainder of Two or More Race Races (NH) - CVAP population - percent of CVAP population Hispanic or Latino - CVAP population - percent of CVAP population Table Usage Notes • Click on a column header to sort on that column; click column header again to sort in other direction. • Click ShowAll button to show all areas and restore full set of data view. • Click State to select all areas in a selected state (click ShowAll between selections). • View additional rows/areas by sliding vertical scrollbar at table right. • Modify column width by dragging column separator in header row. • View additional columns by sliding horizontal scrollbar (leftmost columns remain fixed). Use the CVAP GIS Project The CVAP GIS project can be used to examine small area citizen voting age population characteristics in context of Congressional Districts, state legislative districts and voting districts. Gain insights not possible using tabular data alone. Use CVAP GIS Project to create your own maps similar to those shown above. See additional map views and more details. 1. Install the ProximityOne CV XE GIS (only required if not already installed) ... run the CV XE GIS installer ... take all defaults during installation 2. Download the CVAP 2013 GIS Project fileset ... requires LevelTwo UserID (get ID -- key in CVAP in message section) ... unzip CVAP 2013 GIS project files to local folder c:\cvap2013 3. Open the c:\cvap2013\cvap2013.gis project ... after completing the above steps, click File>Open>Dialog ... open the file named c:\cvap2013\cvap2013.gis 4. Done. Start-up view appears. About the Data Data used in this section are based on the 2013 American Community Survey (ACS) 2009-13 5-year CVAP special tabulation. CVAP estimates have been developed for U.S. national scope geographic areas including the U.S., state, county, city/place, minor civil division, census tract and block group. The scope of the subject matter is focused on total number of United States citizens for the geographic area total number of United States citizens 18 years of age or older for the geographic area, each cross-classified by several race/ethnicity groups. The estimates for the number of citizens and voting age population for each of the race/ethnicity groups is shown in the above interactive table. Support Using these Resources Learn more about demographic economic data and related analytical tools. Join us in a Decision-Making Information Web session. There is no fee for these Web sessions. Each informal session is focused on a specific topic. The open structure also provides for Q&A and discussion of application issues of interest to participants. ProximityOne User Group Join the ProximityOne User Group to keep up-to-date with new developments relating to geographic-demographic-economic decision-making information resources. Receive updates and access to tools and resources available only to members. Use this form to join the User Group. Additional Information ProximityOne develops geographic-demographic-economic data and analytical tools and helps organizations knit together and use diverse data in a decision-making and analytical framework. We develop custom demographic/economic estimates and projections, develop geographic and geocoded address files, and assist with impact and geospatial analyses. Wide-ranging organizations use our software, data and methodologies to analyze their own data integrated with other data. Follow ProximityOne on Twitter at www.twitter.com/proximityone. Contact ProximityOne (888-364-7656) with questions about data covered in this section or to discuss custom estimates, projections or analyses for your areas of interest. |
|
|