

|
|
-- expanding neighborhood-level insights through data analytics .. tools and resources to access and analyze citizen voting age population by block group ... ideally analysts and stakeholders will examine patterns and characteristics of the citizen voting age population (CVAP) by block group. This is partly because of the extreme variability of CVAP within higher level geography -- even at the census tract level. This becomes even more important in more densely populated areas. See about ACS 2014 CVAP block group demographics below. Patterns of CVAP Population by Block Group Houston Area See legend in lower right of graphic for interval/color correspondence. Click graphic for larger view; expand browser window for best quality view. 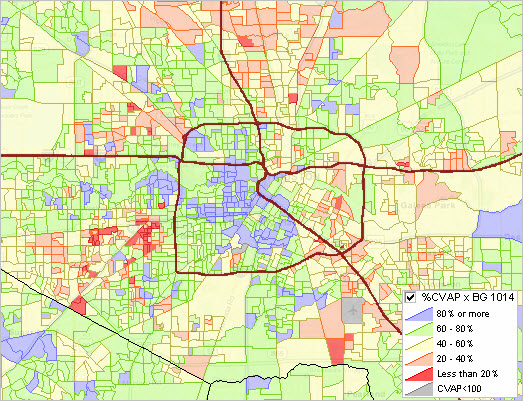 .. view developed with ProximityOne CV XE GIS and related GIS project. The size, characteristics and distribution of the citizen voting age population by block group is very important. • Block groups are the most granular geography at which we can study these demographics. • The size of the citizen voting age population ultimately determines election outcomes. • See illustrative view below of a selected block group and citizen/CVAP attributes by population group. This section provides thematic pattern map views and analyses of selected metros. These applications can be replicated for any area. They serve as an "analytical basis" that can be augmented with other methods and data (e.g., voter registration, voter propensity, voter turnout, and other election factors) to gain insights into election outcomes under alternative scenarios. Equally important, this information can be used to better equip voters with the potential impact of improved voting activity for their own neighborhood and larger areas (e.g., congressional districts). Using these GIS Resources; Obtaining Custom Maps & Analyses Contact us (or call 888.364.7656) for maps and analyses for areas of interest or to use the integrated, ready-to-use, national scope GIS software, GIS project and datasets. Add your own data; create custom views. CVAP Block Group Thematic Pattern Map shown below for Selected Areas • Atlanta • Chicago • Los Angeles • Kansas City • Washington, DC Patterns of ACS 2014 CVAP Population by Block Group Atlanta Area See legend in lower right of graphic for interval/color correspondence. Click graphic for larger view; expand browser window for best quality view. 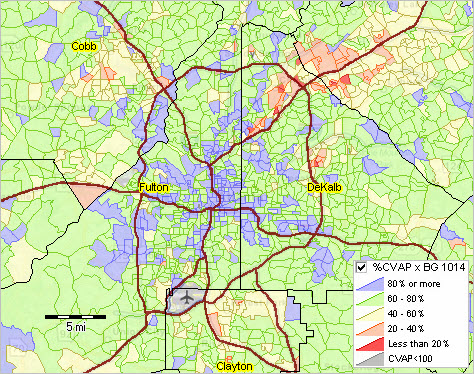 .. view developed with ProximityOne CV XE GIS and related GIS project. Patterns of ACS 2014 CVAP Population by Block Group Chicago Area See legend in upper right of graphic for interval/color correspondence. Click graphic for larger view; expand browser window for best quality view. 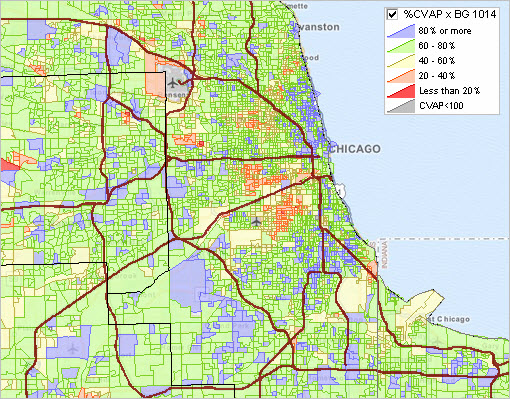 .. view developed with ProximityOne CV XE GIS and related GIS project. Patterns of ACS 2014 CVAP Population by Block Group Los Angeles Area See legend in upper right of graphic for interval/color correspondence. Click graphic for larger view; expand browser window for best quality view. 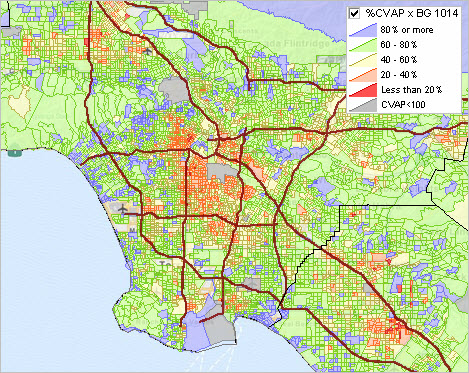 .. view developed with ProximityOne CV XE GIS and related GIS project. Patterns of ACS 2014 CVAP Population by Block Group Kansas City Area See legend in upper right of graphic for interval/color correspondence. Click graphic for larger view; expand browser window for best quality view. 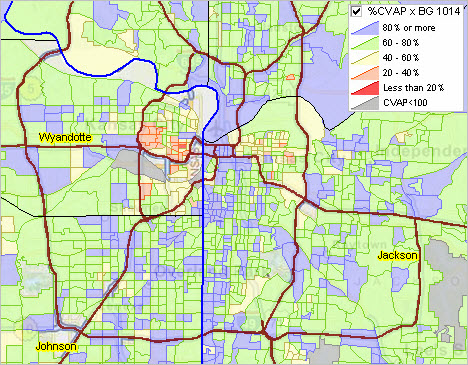 .. view developed with ProximityOne CV XE GIS and related GIS project. Profile of selected Kansas City area block group Orange fill pattern (CVAP 20-40% interval) Kansas block group (202090451002) Mini-profile shows values of citizen (C##) and CVAP (V##) population by population group (01-13 - see below) Click to view map graphic with mini-profile Patterns of ACS 2014 CVAP Population by Block Group Washington, DC Area See legend in lower right of graphic for interval/color correspondence. Click graphic for larger view; expand browser window for best quality view. 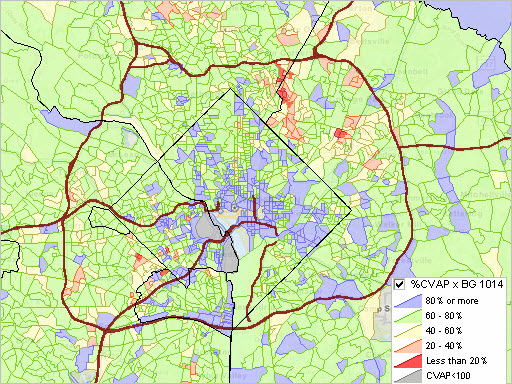 .. view developed with ProximityOne CV XE GIS and related GIS project. ACS 2014 CVAP Block Group Demographics For the 217,479 block groups covering the U.S. wall-to-wall, the median citizen population value is 1,165 (291.8 million population) and the median citizen voting age population is 885 (220 million population). The median total population is 1,252 (314 million population). These data are based on the 2014 American Community Survey ACS 2014 CVAP special tabulation completed in early 2016. WHile the focus here is on the total population, the same scope of data is integrated into the shapefiles used here for 13 race/origin population groups. The 13 race/origin groups include: • American Indian or Alaska Native Alone • Asian Alone • Black Alone • Native Hawaiian or Other Pacific Islander Alone • White Alone • American Indian or Alaska Native and White • Asian and White • Black and White • American Indian or Alaska Native and Black • Remainder of Two or More Races • not Hispanic • Hispanic (of any race) Related CVAP Sections • Census Tracts; ACS 2009-13 special tabulation • Census Tracts; ACS 2009-13 special tabulation - Hispanic focus • Tracts & Congressional Districts; ACS 2009-13 special tabulation Support Using these Resources Learn more about accessing and using demographic-economic data and related analytical tools. Join us in a Data Analytics Lab session. There is no fee for these one-hour Web sessions. Each informal session is focused on a specific topic. The open structure also provides for Q&A and discussion of application issues of interest to participants. Additional Information ProximityOne develops geodemographic-economic data and analytical tools and helps organizations knit together and use diverse data in a decision-making and analytical framework. We develop custom demographic/economic estimates and projections, develop geographic and geocoded address files, and assist with impact and geospatial analyses. Wide-ranging organizations use our tools (software, data, methodologies) to analyze their own data integrated with other data. Follow ProximityOne on Twitter at www.twitter.com/proximityone. Contact us (888-364-7656) with questions about data covered in this section or to discuss custom estimates, projections or analyses for your areas of interest. |
|
|