|
|
|
Demographic Trends of Larger School Districts 2000-2007
This document reviews demographic trends of larger U.S. school districts between 2000 and 2007. As of 2007, there were 947 school districts (of an approximate total 14,000) with 2007 total population of 65,000 population based on the 2007 American Community Survey (ACS). Only school districts with 65,000 population or more are included in the 2007 ACS. The Nation's 947 largest school districts (2007 total population 65,000 or more) changed from a total population of 157,401,264 (55.9 percent of total U.S. population [281,421,906]) to 171,897,907 (57.0 percent of total U.S. population [301,621,159]). The K-12 school age population (ages 5-17 years) changed from of 29,454,410 (55.5 percent of the U.S. population ages 5-17 years [53,118,014]) to 30,459,098 (57.2 percent of the U.S. population ages 5-17 years [53,237,254]). The K-12 school age population (ages 5-17 years) changed from of 29,454,410 (10.5 percent of total U.S. population [281,421,906]) to 30,459,098 (10.1 percent of total U.S. population [301,621,159]). Data for 2000 are based on Census 2000. Data for 2007 are based on the American Community Survey. These data collection and tabulation programs vary in terms of reference date (within year) and errors in tabulation/estimation. The 947 school districts are comprised of 881 secondary and unified districts and 66 elementary districts. As the elementary districts overlap combined secondary and unified districts, only the populations of the 881 secondary and unified districts have been used to develop the above demographic summary. A few of the 947 school districts have had changes to their geographic boundary; these changes are not reflected in the demographics. All 947 school districts are shown in the maps and interactive ranking table shown below. Patterns of School Age (5-17) Population Change, 2000-2007 (school Districts with 2007 population of 65,000 or more) 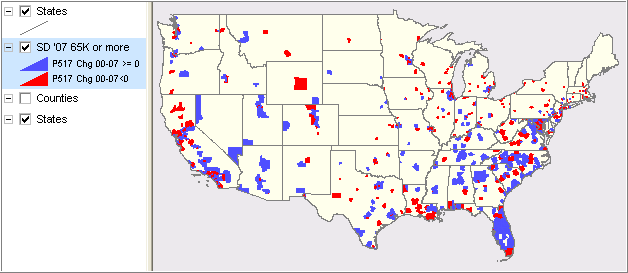
South central region with county boundaries -- school districts with 65,000 population as of 2007 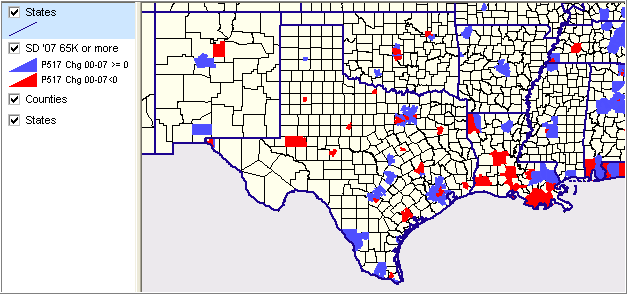
Demographic Characteristics and Trends Among Larger School Districts, 2000-2007 Interactive Ranking Table -- click column header to sort; click again to sort other direction. See related Ranking Tables Main Page Data sources: Census 2000 and American Community Survey 2007. Data development and analyses by Proximity. Includes only school districts 65,000 total population as of 2007. A few districts did not exist as of 2000; some have been reconfigured. No adjustments for possible boundary changes. Ranking Table Column Descriptions Code - Federal school district code LoGr - low grade HiGr - High grade Census 2000 population TotPop00 - Total Pop0-4 00 - Ages 0-4 years Pop5-17 00 - Ages 5-17 years %Pop5-17 00 - Ages 5-17 years percent of total 2007 population TotPop07 Pop0-4 07 - Ages 0-4 years Pop5-17 07 - Ages 5-17 years %Pop5-17 07 - Ages 5-17 years percent of total Change 2000-2007 Chg 5-17 00-07 - Percent change ages 5-17 years %Chg 5-17 00-07 - Percent change ages 5-17 years |
|
|