
|
|
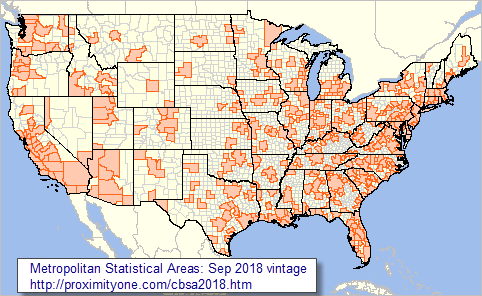
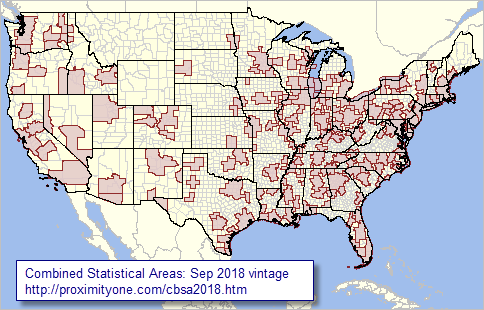
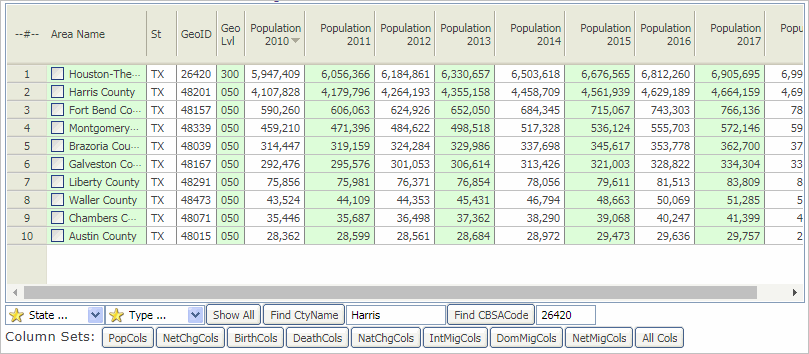
.. Metropolitan Statistical Areas (MSAs) & Micropolitan Statistical Areas (MISAs) .. CBSAs and county components August 2019. It is likely that the OMB defined September 2018 Core Based Statistical Areas (CBSAs) will be the CBSA vintage used for tabulation of the Census 2020 results. The Sept. 2018 vintage CBSAs may be in use until 2022-23 when some major restructuring, and a new vintage evolves. CBSAs, or metros, are defined as one of more continguous counties. This section is focused on providing an interactive table that enables a reference and analytical view of the CBSAs and component counties. All counties are included in the table below. • See how 2018 vintage MSAa are used for thematic maps. .. Housing Price Index • See the main CBSAs metros section. CBSAs are important for many reasons. These areas contain 93-percent of the U.S. population (1,916 counties of a total 3,142). Federal statistical and other data are often available for CBSAs as the lowest level of geographic disaggreation. Businesses tend to examine characteristics and trends among CBSAs. Statistical surveys are often thin enough that data can only be developed for the larger CBSAs. Understanding the geodemographic relationships is essential for wide-ranging decision-making, program management and data analytics in general. This section provides information on the OMB defined September 2018 Core Based Statistical Areas (CBSAs). These CBSAs are comprised of 392 Metropolitan Statistical Areas (MSAs), 384 MSAs in the U.S. and 8 in Puerto Rico, and 546 Micropolitan Statistical Areas (MISAs), 542 in the U.S. and 4 in Puerto Rico. For those MSAs that qualify, 11 MSAs are subdivided into 31 Metropolitan Divisions (MDs). Metropolitan Statistical Areas, Sep 2018 Vintage The following graphic shows the 2018 vintage Metropolitan Statistical Areas (MSAs). Use the associated GIS project to examine different years or subject matter items. Click graphic for larger view showing combined MSAs and MISAs. Expand browser window for best quality view.  .. view developed with ProximityOne CV XE GIS and related GIS project. .. create other views, geospatial analysis, integrate other data using the associated GIS project Micropolitan Statistical Areas, Sep 2018 Vintage The following graphic shows the 2018 vintage Micropolitan Statistical Areas (MISAs). Use the associated GIS project to examine different years or subject matter items. Click graphic for larger view showing combined MSAs and MISAs. Expand browser window for best quality view.  .. view developed with ProximityOne CV XE GIS and related GIS project. .. create other views, geospatial analysis, integrate other data using the associated GIS project Combined Statistical Areas, Sep 2018 Vintage The following graphic shows the 2018 vintage Combined Statistical Areas (CSAs). CSAs are contiguous CBSAs that are combined to form a CSA when certain conditions are met. Use the associated GIS project to examine different years or subject matter items. Click graphic for larger view showing CSAs with county overlay (visually determining which counties are in a CSA). Expand browser window for best quality view.  .. view developed with ProximityOne CV XE GIS and related GIS project. .. create other views, geospatial analysis, integrate other data using the associated GIS project Using the County & 2018 CBSAs: MSAs & MISAs interactive table The following view illustrates how the interactive table below this graphic can be used to examine the compostion of a single metro. There are many other ways the table can be used. In this example, the following steps took place: • Click Showall Button or refresh page. • Click the PopCols button below the table to show only selected columns. • Click the Find CBSA Code to view the CBSA and component counties (counties with this CBSA code. • The resulting view is then sorted on population 2010 (click pop2010 header cell). The view now shows the metro on the top row with components counties ranked in descending order. Do this for any metro. This is the only tool that can perform these operations.  U.S. All County & Sept. 2018 Vintage CBSAs: MSAs & MISAs interactive table CBSA: Core-Based Statistical Areas; MSAs & MISAs Extended demographic time series and components of change included for all areas. Initial order: all counties followed by all CBSAs. Click column header to sort; again to sort other direction. Click ShowAll button between queries to refresh. Usage notes below table. See related Interactive Tables. Usage Notes • Click ShowAll between queries/filters. • Widen/narrow a column by dragging the column header divider bar. • View columns to right, not showing in table, by using the scroll bar below the table. • All counties are included in the table. .. a county is in a CBSA (MSA or MISA) or not in a CBSA (metro). .. to view all counties only, click ShowAll then Type=050. • PopCols button .. click button to view Population 2010-18 columns. Column Descriptions .. goto top
- Area Name
- St - St1 - GeoID - Geo Lvl - Rg - Div - CBSA Name - CBSA - CBSA Type - MD Name - MD Code - CSA Name - CSA Code - Cty Status - Population Census 2010 - Population Base 2010 - Population 2010 - Population 2011 - Population 2012 - Population 2013 - Population 2014 - Population 2015 - Population 2016 - Population 2017 - Population 2018 - Pop Net Chg 2010 - 4/1/10-7/1/10 - Pop Net Chg 2011 - Pop Net Chg 2012 - Pop Net Chg 2013 - Pop Net Chg 2014 - Pop Net Chg 2015 - Pop Net Chg 2016 - Pop Net Chg 2017 - Pop Net Chg 2018 - Births 2010 - 4/1/10-7/1/10 - Births 2011 - Births 2012 - Births 2013 - Births 2014 - Births 2015 - Births 2016 - Births 2017 - Births 2018 - Deaths 2010 - 4/1/10-7/1/10 - Deaths 2011 - Deaths 2012 - Deaths 2013 - Deaths 2014 - Deaths 2015 - Deaths 2016 - Deaths 2017 - Deaths 2018 - Natural Change 2010 - 4/1/10-7/1/10 - Natural Change 2011 - Natural Change 2012 - Natural Change 2013 - Natural Change 2014 - Natural Change 2015 - Natural Change 2016 - Natural Change 2017 - Natural Change 2018 - Intl Migration 2010 - 4/1/10-7/1/10 - Intl Migration 2011 - Intl Migration 2012 - Intl Migration 2013 - Intl Migration 2014 - Intl Migration 2015 - Intl Migration 2016 - Intl Migration 2017 - Intl Migration 2018 - Domestic Migration 2010 - 4/1/10-7/1/10 - Domestic Migration 2011 - Domestic Migration 2012 - Domestic Migration 2013 - Domestic Migration 2014 - Domestic Migration 2015 - Domestic Migration 2016 - Domestic Migration 2017 - Domestic Migration 2018 - Net Migration 2010 - 4/1/10-7/1/10 - Net Migration 2011 - Net Migration 2012 - Net Migration 2013 - Net Migration 2014 - Net Migration 2015 - Net Migration 2016 - Net Migration 2017 - Net Migration 2018 - Residual 2010 - 4/1/10-7/1/10 - Residual 2011 - Residual 2012 - Residual 2013 - Residual 2014 - Residual 2015 - Residual 2016 - Residual 2017 - Residual 2018 - GQPOPBASE - GQPOP2010 - 4/1/10-7/1/10 - GQPOP2011 - GQPOP2012 - GQPOP2013 - GQPOP2014 - GQPOP2015 - GQPOP2016 - GQPOP2017 - GQPOP2018 About CBSA Vintages .. goto top CBSAs are periodically re-designated by OMB based primarily on Census Bureau data. Designations include naming and specification of which counties are designated components of CBSAs. Recent modifications to CBSA designations are: Sep. 2018 Apr. 2018 Aug. 2017 Jul. 2015 Feb. 2013 ProximityOne User Group Join the ProximityOne User Group to keep up-to-date with new developments relating to metros and component geography decision-making information resources. Receive updates and access to tools and resources available only to members. Use this form to join the User Group. Support Using these Resources Learn more about accessing and using demographic-economic data and related analytical tools. Join us in a Data Analytics Lab session. There is no fee for these one-hour Web sessions. Each informal session is focused on a specific topic. The open structure also provides for Q&A and discussion of application issues of interest to participants. Additional Information ProximityOne develops geodemographic-economic data and analytical tools and helps organizations knit together and use diverse data in a decision-making and analytical framework. We develop custom demographic/economic estimates and projections, develop geographic and geocoded address files, and assist with impact and geospatial analyses. Wide-ranging organizations use our tools (software, data, methodologies) to analyze their own data integrated with other data. Follow ProximityOne on Twitter at www.twitter.com/proximityone. Contact us (888-364-7656) with questions about data covered in this section or to discuss custom estimates, projections or analyses for your areas of interest. |
|
|