
|
|
Examining Health Characteristics by Census Tract
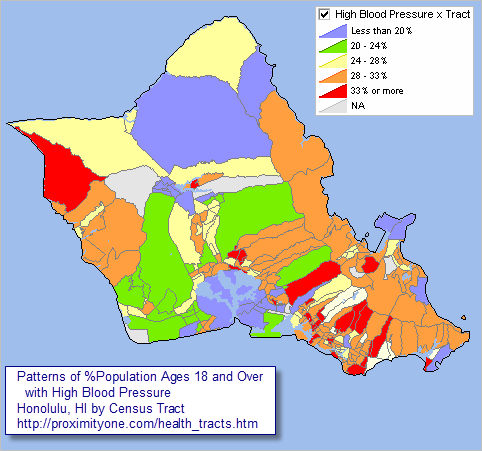
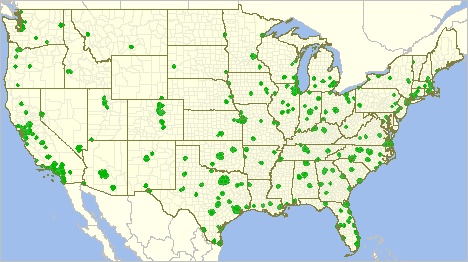
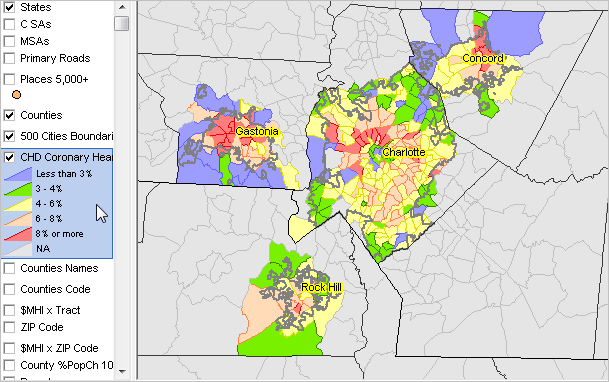
At the census tract/neighborhood level, 937 tracts were estimated to have more than 10% of the population ages 18 years and over with coronary heart disease. What are characteristics of health-related factors in your city, neighborhood and census tracts of interest? Use tools reviewed in this section to access/analyze a wide range of health-related characteristics (see item list below) -- not available at the city or census tract level before. Patterns of High Blood Pressure: Honolulu, HI by Census Tract  - Click graphic for larger view with high blood pressure %population - View developed with CV XE GIS software and related GIS project/fileset. Accsss/analyze these data for approximately 28,000 tracts (of a total approximate 74,000) on topics including chronic disease risk factors, health outcomes and clinical preventive service use for the largest 500 cities in the U.S. These small area data enable stakeholders in cities, local health departments, neighborhoods and study areas to better understand the characteristics and geographic distribution of health-related measures and how they might impact health-related programs and other demographic-economic issues. Scope of 500 Cities The following graphic shows the 500 cities (green areas) included in project. Data for these cities and intersecting tracts are available. Click graphic for larger view providing county visibility and city name labels. Expand browser to full window for best quality view.  - View developed with CV XE GIS software and related GIS project/fileset. Analytical Potential The 500 Cities data have been developed as a part of the CDC 500 Cities project, a collaboration between the Centers for Disease Control (CDC), the Robert Wood Johnson Foundation and the CDC Foundation. These data provide only the health characteristics attributes. They are a small, but important, subset of a larger set of key health metrics. These data are estimates subject to errors of estimation and provide a snapshot view of one point in time. The value of these data can be leveraged by linking them with other demographic-economic data from the American Community Survey (ACS 2015) tract and city data. Integrate and analyze these data with related data and alternative geography. See related health data analytics section. Integrate and analyze these data with related data and alternative geography. ProximityOne develops and analyzes demographic estimates and projections and performs studies using these data. Health-related patterns and characteristics of the population is one of many subject matter areas. See about other healthcare related sections in this related section. Patterns of Coronary Heart Disease (CHD) by Tract; Charlotte, NC-SC Area This graphic illustrates CHD patterns by census tract for cities included in the database. Gray areas are census tracts not included in the 500 cities database.  - View developed with CV XE GIS software and related GIS project/fileset. Additional City/Area Views - Create your own views using CV XE GIS software and related GIS project/fileset. - Most of these view show patterns of coronary heart disease/ .. an additional view for Honolulu shows patterns of high blood pressure. - Use the GIS tools/dataset to examine other health measures. - Zoom-in to areas of interest; label & set color patterns & ranges in different ways. - Statistically relate the health measures with other population & housing unit characteristics .. included in the same dataset. - Optionally examine city characteristics overlayed with tract level patterns. - Set queries to determine location of areas that meet certain criteria.
Health Characteristics by City -- Interactive Table See usage notes below table. Click ShowAll button between Find/Queries. See related demographic-economic interactive tables. Using the Interactive Table • Click on a column header to sort on that column; click column header again to sort in other direction. • Click ShowAll button to show all tabulation areas and restore full set of data view. • Click State to select on geographies in a selected state (click ShowAll between selections). • Click GeoType to select a type of geography (click ShowAll between selections). Measures Included - go top • Current lack of health insurance among adults aged 18-64 Years • Arthritis among adults aged >=18 Years • Binge drinking among adults aged >=18 Years • High blood pressure among adults aged >=18 Years • Taking medicine for high blood pressure control among adults aged >=18 Years with high blood pressure • Cancer (excluding skin cancer) among adults aged >=18 Years • Current asthma among adults aged >=18 Years • Coronary heart disease among adults aged >=18 Years • Visits to doctor for routine checkup within the past Year among adults aged >=18 Years • Cholesterol screening among adults aged >=18 Years • Fecal occult blood test, sigmoidoscopy, or colonoscopy among adults aged 50-75 Years • Chronic obstructive pulmonary disease among adults aged >=18 Years • Physical health not good for >=14 days among adults aged >=18 Years • Older adult men aged >=65 Years who are up to date on a core set of clinical preventive services: .. Flu shot past Year, PPV shot ever, Colorectal cancer screening • Older adult women aged >=65 Years who are up to date on a core set of clinical preventive services: .. Flu shot past Year, PPV shot ever, Colorectal cancer screeni • Current smoking among adults aged >=18 Years • Visits to dentist or dental clinic among adults aged >=18 Years • Diagnosed diabetes among adults aged >=18 Years • High cholesterol among adults aged >=18 Years who have been screened in the past 5 Years • Chronic kidney disease among adults aged >=18 Years • No leisure-time physical activity among adults aged >=18 Years • Mammography use among women aged 50-74 Years • Mental health not good for >=14 days among adults aged >=18 Years • Obesity among adults aged >=18 Years • Papanicolaou smear use among adult women aged 21-65 Years • Physical health not good for >=14 days among adults aged >=18 Years • Sleeping less than 7 hours among adults aged >=18 Years • Stroke among adults aged >=18 Years • All teeth lost among adults aged >=65 Years Support Using these Resources Learn more about accessing and using demographic-economic data and related analytical tools. Join us in a Data Analytics Lab session. There is no fee for these one-hour Web sessions. Each informal session is focused on a specific topic. The open structure also provides for Q&A and discussion of application issues of interest to participants. ProximityOne User Group Join the ProximityOne User Group to keep up-to-date with new developments relating to geographic-demographic-economic decision-making information resources. Receive updates and access to tools and resources available only to members. Use this form to join the User Group. Additional Information ProximityOne develops geographic-demographic-economic data and analytical tools and helps organizations knit together and use diverse data in a decision-making and analytical framework. We develop custom demographic/economic estimates and projections, develop geographic and geocoded address files, and assist with impact and geospatial analyses. Wide-ranging organizations use our tools (software, data, methodologies) to analyze their own data integrated with other data. Follow ProximityOne on Twitter at www.twitter.com/proximityone. Contact ProximityOne (888-364-7656) with questions about data covered in this section or to discuss custom estimates, projections or analyses for your areas of interest. |
|
|