
|
|
|
New Residential Construction by County
September 2016. Understanding the housing situation; examining housing supply and demand market conditions; assessing trends by county ... and how counties of interest are changing. This section provides a summary of new housing units authorized by building permits for new residential construction for each/all counties. Use data analytics tools and data described here analyze these data and related housing issues. • interactive data analytics - see below • use GIS project/datasets - see below • access individual county profiles - see below Related Residential Construction & Housing Sections • Metro Situation & Outlook Reports .. metro by metro ... examples: Houston, Los Angeles, Chicago, Atlanta. • U.S. by Metro Interactive Table • County & City/Place Monthly Patterns of New Authorized Residential Units by County The following graphic shows the per capita value of total units authorized by county. The four largest Texas metros are shown with bold brown boundaries. See about subject matter included in datasets. 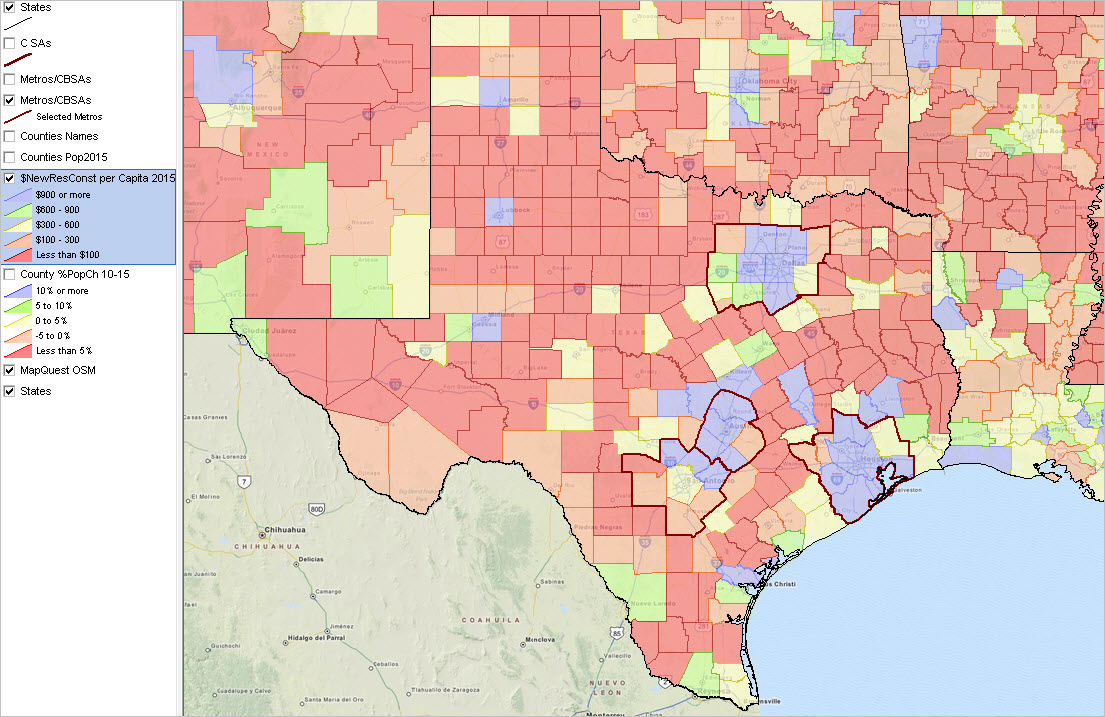 View created with CV XE GIS. Click graphic for larger view. Additional views with counties labeled with name, 2015 housing units and 2015 total new housing units authorized. • Charlotte, NC-SC metro by county • Dallas, TX metro by county • Houston, TX metro by county Leading Economic Indicator Building permit data (housing units authorized by building permits for new residential construction) are economic leading indicators. Investors and housing developers use these data to examine the characteristics and trends in new residential housing development. The short time lag between the data reference date and data access date, 1-2 months, makes this set of indicators important in assessing the current situation and patterns during the past year or more. The national scope coverage and geographic granularity (state, metro, county and city) enable comparison among types of areas and peer groups. Finance and real estate professional and researchers examine building permit patterns to develop strategic insights. Government and policy makers use these data to get a pulse on markets and changing patterns to administer programs and operations. See more about these data below in this section. New residential construction begins with building permits. Overall U.S. housing starts are approximately 2.5% less than permits issued (22.5% less for multi-family units). Completions are approximately 4% less than starts (7.5% less for multi-family units). During the past year-plus, "residential fixed investment" has been approximately $500 billion and remained steady at 3.1% of real Gross Domestic Product. Access Individual County Profiles The following graphic illustrates use of the Regional Demographic-Economic Modeling System (RDEMS) to access the HSG1 Housing Units & New Residential Construction tables for a selected county. Click graphic for larger view. Mecklenburg County, NC [37119] located in the Charlotte, NC-SC metro  Add a link to your Web page for areas of interest: The URL structure for Mecklenburg County is: - http://proximityone.com/rdems/1/rdems37119hsg1.htm - more in general, substitute the county state+county FIPS code (37119 in this case) to access a county of interest. Access a county of interest using links in the interactive table below. Using the Interactive Table The interactive table shown below includes a row for each county. Column structure and content are described below the table. • Click the StCty link (column 4) where active to view the RDEMS housing unit/new construction profile. • Select a metro (below table) to examine metro component counties .. for example, determine that among all Dallas metro counties, Dallas county had the largest 2015 new residential construction (21,698) .. but that Collin County had the largest value of new construction. • See about more operations and usage notes below table. New Authorized Residential Construction by County -- 2014, 2015 & Change -- Interactive Table Click ShowAll button between Find/Queries. See usage notes below table. Use mouseover on column header to view column description. See related tables -- http://proximityone.com/rankingtables.htm. Usage Notes The table includes a row for each county. • Click ShowAll button to reset table: • Click a column header to sort on that column; click again to sort other direction. • Click the StCty link (column 4) where active to view the RDEMS housing unit/new construction profile. .. view those data in context with related subject matter tables. .. see an example for Dallas County, TX. • Find-in-Name button .. enter a partial case-sensitive county name in the edit box to right of Find in Name button. .. click Find-in-Name button to show only rows with that text in the name (column 1). • Use FindCBSA button to select/filter for all counties in a CBSA/metro: .. get 5-character CBSA code from scroll section at right above table. .. enter CBSA 5-character code in edit box at right of CBSA button. .. click ShowAll button. .. click CBSA button to view/analyze tracts in this CBSA. • Use ColSet1 to views elected columns: .. totals for 2014 (3 columns) .. totals for 2015 (3 columns) .. totals for 2014-15 (3 columns) • Click ShowAll button between specific queries. Subject Matter Items New authorized residential construction data can be organized and conceptualized as shown in the following table.
The full set of items in the table and the GIS project dataset are described below. There are five sets of columns organized from left to right: - county name and identifiers - 2014 & 2015 population and housing units - 2014, 2015, and 2014-15 change summarized for all types of housing units - 2014 data by type of housing unit (e.g., single family, 2 family, ...) - 2015 data by type of housing unit (e.g., single family, 2 family, ...) - 2014-15 change data by type of housing unit (e.g., single family, 2 family, ...) Description of all columns:
- Name - area name
- St1 - state abbreviation - St2 - StCty - CBSA - Population 2014 - Population 2015 - Housing Units 2014 - Housing Units 2015 - Buildings 2014 - Units 2014 - Value 2014 - Buildings 2015 - Units 2015 - Value 2015 - BuildingsCh 2014-15 - UnitsCh 2014-15 - ValueCh 2014-15 - Buildings 1 Family 2014 - Units 1 Family 2014 - Value 1 Family 2014 - Buildings 2 Family 2014 - Units 2 Family 2014 - Value 2 Family 2014 - Buildings 3-4 Family 2014 - Units 3-4 Family 2014 - Value 3-4 Family 2014 - Buildings 5+ Family 2014 - Units 5+ Family 2014 - Value 5+ Family 2014 - Buildings 1 Family 2015 - Units 1 Family 2015 - Value 1 Family 2015 - Buildings 2 Family 2015 - Units 2 Family 2015 - Value 2 Family 2015 - Buildings 3-4 Family 2015 - Units 3-4 Family 2015 - Value 3-4 Family 2015 - Buildings 5+ Family 2015 - Units 5+ Family 2015 - Value 5+ Family 2015 - Buildings 1 Family 2014-15 Change - Units 1 Family 2014-15 Change - Value 1 Family 2014-15 Change - Buildings 2 Family 2014-15 Change - Units 2 Family 2014-15 Change - Value 2 Family 2014-15 Change - Buildings 3-4 Family 2014-15 Change - Units 3-4 Family 2014-15 Change - Value 3-4 Family 2014-15 Change - Buildings 5+ Family 2014-15 Change - Units 5+ Family 2014-15 Change - Value 5+ Family 2014-15 Change Housing Units Authorized (HUA) GIS Project & Datasets (requires Windows computer with Internet connection) Use the U.S. by Metropolitan Area Housing Units Authorized (HUA) GIS project to create thematic pattern views similar to the one shown above. Zoom-in to any metro/region. Add your own data; change colors, labeling, subject matter used for pattern analysis. Follow these steps to get started. 1. Install the ProximityOne CV XE GIS ... run the CV XE GIS installer ... take all defaults during installation 2. Download the HUA GIS project fileset ... requires User ID ... more information ... unzip HUA GIS project files to local folder c:\bp 3. Open the c:\bp\bp1.gis project ... after completing the above steps, click File>Open>Dialog ... open the file named c:\bp\bp1.gis 4. Done. U.S. by metro thematic pattern view appears. Join us in the Data Analytics Lab sessions to learn more about using this GIS project, subject matter and related analyses. About these Data New authorized residential construction monthly time series data enables analysts to examine trends and can provide insights into business cycles, upturns and downturns. It may take four months to establish an underlying trend for building permit authorizations, five months for total starts and six months for total completions. The limitation of the building permits data is that they are neither housing starts or completions. Housing starts and completions data are not available with the same geographic granularity as building permits nor do they have the same recent estimates and monthly time series features of building permits. What about starts and completions? See about the related Survey of Construction and data tabnulated on housing starts, completions and sales. The low level geography for these data is Census region. Data on construction authorized by building permits are based upon reports submitted by local building permit officials in response to a mail survey. They are obtained using Form C-404, "Report of Building or Zoning Permits Issued and Local Public Construction." Single Family Houses - Includes all detached one-family houses. Also includes all attached one-family houses separated by a wall that extends from ground to roof with no common heating system or interstructural public utilities. Includes prefabricated, sectionalized, panelized, and modular homes which are manufactured partially off-site, but which are transported and assembled at the construction site. Excludes mobile homes. Two-Family Buildings - Includes all buildings containing two housing units which may be one above the other or side-by-side. If built side-by-side, they (1) do not have a wall that extends from ground to roof or (2) share a heating system, or (3) have interstructural public utilities such as water supply/sewage disposal. Three- and Four-Family Buildings - Includes all buildings containing three or four housing units. If built side-by-side, they (1) do not have a wall that extends from ground to roof, or (2) share a heating system, or (3) have interstructural public utilities such as water supply/sewage disposal. Five-or-More Family Buildings - Includes all buildings containing five or more housing units. If built side-by-side, they (1) do not have a wall that extends from ground to roof, or (2) share a heating system, or (3) have interstructural public utilities such as water supply/sewage disposal. ProximityOne User Group Join the ProximityOne User Group to keep up-to-date with new developments relating to metros and component geography decision-making information resources. Receive updates and access to tools and resources available only to members. Use this form to join the User Group. Support Using these Resources Learn more about accessing and using demographic-economic data and related analytical tools. Join us in a Data Analytics Lab session. There is no fee for these one-hour Web sessions. Each informal session is focused on a specific topic. The open structure also provides for Q&A and discussion of application issues of interest to participants. Additional Information ProximityOne develops geodemographic-economic data and analytical tools and helps organizations knit together and use diverse data in a decision-making and analytical framework. We develop custom demographic/economic estimates and projections, develop geographic and geocoded address files, and assist with impact and geospatial analyses. Wide-ranging organizations use our tools (software, data, methodologies) to analyze their own data integrated with other data. Follow ProximityOne on Twitter at www.twitter.com/proximityone. Contact us (888-364-7656) with questions about data covered in this section or to discuss custom estimates, projections or analyses for your areas of interest. |
|
|