
| Decision-Making Information |
|
ProximityOne information resources & solutions (888) DMI-SOLN (888) 364-7656 Put data to work more effectively. Certificate in Data Analytics Power of Combining Maps with Data Support & Technical Assistance help using these resources Metro in Regional Context 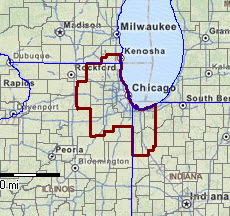 |
Situation & Outlook Report
Chicago-Naperville-Elgin, IL-IN-WI Metropolitan Statistical Area (CBSA 16980)
Geographic-Demographic-Economic Characteristics -- access other areas
See about updates.
This section is no longer being updated. Access the permanent replacement section at http://proximityone.com/cbsa/1/cbsa16980.htm. Please bookmark this new URL.
Access 2018 S&O Reports, featuring county and metro projections to 2030, via the interactive table at http://proximityone.com/metros.htm. The 2018 reports are similar but have been greatly expanded and updated.
Contents of this Report
This document is organized into these sections:
1. Recent Trends & Outlook
Summary of recent business, demographic, economic trends; year-ahead & 5-year outlook.
- the Recent Trends & Outlook section, updated quarterly, covers topics about this metro such as .. assessing the implications of next jobs report .. impact of Fed''s interest rate action .. which sectors are expanding or contracting .. housing market conditions .. insights to help your planning and decision-making. The Recent Trends & Outlook section is available in the subscription edition.
2. Overview & Update
The total population of the Chicago-Naperville-Elgin, IL-IN-WI MSA metro changed from 9,471,357 in 2010 to 9,557,294 in 2015, a change of 79,674 (0.8%). Among all 917 metros, this metro was ranked number 3 in 2010 and 3 in 2015, based on total population. Annual net migration was -31,997 (2011), -29,185 (2012), -23,447 (2013), -36,047 (2014), -36,047 (2015). View annual population estimates and components of change table. See more about population characteristics below.
This metro is projected to have a total population in 2020 of 10,261,110. The projected population change from 2010 to 2020 is 791,041 (8.4%). The population ages 65 years and over is projected to change from 1,114,611 (2010) to 1,705,250 (2020), a change of 590,639 (53.0%). See more about population projections.
Based on per capita personal income (PCPI), this metro was ranked number 42 in 2008 and 57 in 2014. among the 917 metros for which personal income was estimated.The PCPI changed from $46,910 in 2008 to $50,690 in 2014, a change of $3,780 (8.1%). Per capita personal income (PCPI) is a comprehensive measure of individual economic well-being. Use the interactive table to compare PCPI in this metro to other metros. See more about PCPI in Economic Characteristics section below.
282 metropolitan statistical areas, of the total 381, experienced an increase in real Gross Domestic Product (GDP) between 2009 and 2014. This metro ranked number 3 among the 381 metros based on 2014 GDP. The GDP (millions of current dollars) changed from $521,172 in 2009 to $610,552 in 2014 a change of $89,380 (17.15%). Real GDP (millions of real, inflation adjusted, dollars) changed from $521,172 in 2009 to $557,745 in 2014, a change of $36,573 (7.02%). GDP is the most comprehensive measure of metro economic activity. GDP is the sum of the GDP originating in all industries in the metro. See more about GDP in Economic Characteristics section below.
Attributes of driil-down, small area geography within the metro ... metros account for 65,744 of the national scope 73,056 census tracts (others are in non-metro areas). This metro is comprised of 2,215 tracts covering the metro wall-to-wall. View, rank, compare demographic-economic attributes of these tracts using the interactive tables. Use the CBSA code 16980; see table usage details below the table.
Fortune 1000 Companies with headquarters in this metro.
• AAR Corp.
• AbbVie Inc.
• Abbott Laboratories
• Allegheny Technologies Incorporated
• Anixter International Inc.
• AptarGroup, Inc.
• Arthur J. Gallagher & Co.
• Baxter International Inc.
• Beam Suntory Inc.
• Boeing
• Brunswick Corporation
• CDW Corporation
• CF Industries Holdings, Inc.
• CME Group Inc.
• DeVry Education Group Inc.
• Discover Financial Services
• Dover Corporation
• Equity Residential
• Exelon Corporation
• Fortune Brands Home & Security, Inc.
• General Growth Properties, Inc.
• Groupon, Inc.
• Hillshire Brands Company
• Hospira, Inc.
• Hub Group, Inc.
• Hyatt Hotels Corporation
• IDEX Corporation
• Illinois Tool Works Inc.
• Ingredion Incorporated
• Integrys Energy Group, Inc.
• Jones Lang LaSalle Incorporated
• Kemper Corporation
• Kraft Foods Group, Inc.
• LKQ Corporation
• McDonald's Corporation
• Mead Johnson Nutrition Company
• Molex Incorporated
• Mondelez International, Inc.
• Motorola Solutions, Inc.
• Navistar International Corporation
• NiSource Inc.
• Northern Trust Corporation
• Old Republic International Corporation
• Packaging Corporation of America
• R.R. Donnelley & Sons Company
• Ryerson Holding Corporation
• Sears Holdings Corporation
• Sears Hometown and Outlet Stores, Inc.
• Sirva, Inc.
• Snap-on Incorporated
• Stericycle, Inc.
• Telephone and Data Systems, Inc.
• Tenneco Inc.
• The Allstate Corporation
• TreeHouse Foods, Inc.
• Tribune Company
• US Foods, Inc.
• USG Corporation
• Ulta Salon, Cosmetics & Fragrance, Inc.
• United Continental Holdings, Inc.
• United Stationers Inc.
• Ventas, Inc.
• W.W. Grainger, Inc.
• Walgreen Co.
Number in this metro: 64. Extended data & analysis in subscription edition.• AbbVie Inc.
• Abbott Laboratories
• Allegheny Technologies Incorporated
• Anixter International Inc.
• AptarGroup, Inc.
• Arthur J. Gallagher & Co.
• Baxter International Inc.
• Beam Suntory Inc.
• Boeing
• Brunswick Corporation
• CDW Corporation
• CF Industries Holdings, Inc.
• CME Group Inc.
• DeVry Education Group Inc.
• Discover Financial Services
• Dover Corporation
• Equity Residential
• Exelon Corporation
• Fortune Brands Home & Security, Inc.
• General Growth Properties, Inc.
• Groupon, Inc.
• Hillshire Brands Company
• Hospira, Inc.
• Hub Group, Inc.
• Hyatt Hotels Corporation
• IDEX Corporation
• Illinois Tool Works Inc.
• Ingredion Incorporated
• Integrys Energy Group, Inc.
• Jones Lang LaSalle Incorporated
• Kemper Corporation
• Kraft Foods Group, Inc.
• LKQ Corporation
• McDonald's Corporation
• Mead Johnson Nutrition Company
• Molex Incorporated
• Mondelez International, Inc.
• Motorola Solutions, Inc.
• Navistar International Corporation
• NiSource Inc.
• Northern Trust Corporation
• Old Republic International Corporation
• Packaging Corporation of America
• R.R. Donnelley & Sons Company
• Ryerson Holding Corporation
• Sears Holdings Corporation
• Sears Hometown and Outlet Stores, Inc.
• Sirva, Inc.
• Snap-on Incorporated
• Stericycle, Inc.
• Telephone and Data Systems, Inc.
• Tenneco Inc.
• The Allstate Corporation
• TreeHouse Foods, Inc.
• Tribune Company
• US Foods, Inc.
• USG Corporation
• Ulta Salon, Cosmetics & Fragrance, Inc.
• United Continental Holdings, Inc.
• United Stationers Inc.
• Ventas, Inc.
• W.W. Grainger, Inc.
• Walgreen Co.
3. Lay of the Land & Neighborhood Patterns of Economic Prosperity go top
3.1. Lay of the Land go top
Lay of the Land. The following map shows the metro with bold boundary.
Counties are labeled with county name and state-county FIPS code.
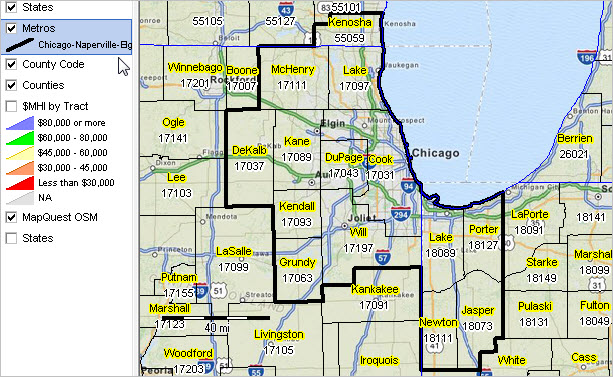
View developed with CV XE GIS software. See this section to learn about making custom metro maps.
3.2. Patterns of Economic Prosperity by Neighborhood go top
Median household income by census tract (see color/data legend at left of map).
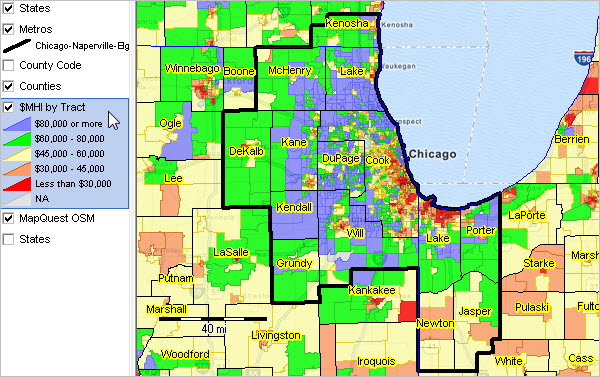
View developed with CV XE GIS software. See this section to learn about making custom metro maps.
4. Population Characteristics & Trends go top
Updated monthly, quarterly, annually. Housing market conditions and extended detail Available in subscription edition.
4.1. Component City Characteristics go top
Principal Cities (about principal cities); Click link to view city profile.
• Arlington Heights
• Chicago
• Des Plaines
• Elgin
• Evanston
• Gary
• Hoffman Estates
• Naperville
• Schaumburg
• Skokie
Cities 10,000 population and over; click link to view city profile.
| Area | Census 2010 | July 1 2010 | July 1 2011 | July 1 2012 | July 1 2013 | July 1 2014 | Change 2010-14 | %Change 2010-14 |
| Addison, IL (1700243) | 36,942 | 37,005 | 37,164 | 37,251 | 37,363 | 37,297 | 292 | 0.80 |
| Algonquin, IL (1700685) | 30,046 | 30,070 | 30,005 | 29,965 | 30,455 | 30,410 | 340 | 1.10 |
| Alsip, IL (1701010) | 19,277 | 19,289 | 19,346 | 19,411 | 19,452 | 19,427 | 138 | 0.70 |
| Antioch, IL (1701595) | 14,430 | 14,464 | 14,427 | 14,400 | 14,424 | 14,411 | -53 | -0.40 |
| Arlington Heights, IL (1702154) | 75,101 | 75,163 | 75,394 | 75,775 | 76,006 | 76,024 | 861 | 1.10 |
| Aurora, IL (1703012) | 197,899 | 198,161 | 199,273 | 199,814 | 200,102 | 200,456 | 2,295 | 1.20 |
| Barrington, IL (1703844) | 10,327 | 10,328 | 10,330 | 10,337 | 10,362 | 10,373 | 45 | 0.40 |
| Bartlett, IL (1704013) | 41,208 | 41,264 | 41,430 | 41,565 | 41,686 | 41,632 | 368 | 0.90 |
| Batavia, IL (1704078) | 26,045 | 26,182 | 26,329 | 26,387 | 26,404 | 26,424 | 242 | 0.90 |
| Beach Park, IL (1704303) | 13,638 | 13,824 | 13,829 | 13,849 | 13,925 | 13,988 | 164 | 1.20 |
| Bellwood, IL (1704975) | 19,071 | 19,082 | 19,119 | 19,155 | 19,179 | 19,152 | 70 | 0.40 |
| Bensenville, IL (1705248) | 18,352 | 18,365 | 18,436 | 18,473 | 18,524 | 18,487 | 122 | 0.70 |
| Berwyn, IL (1705573) | 56,657 | 56,676 | 56,748 | 56,818 | 56,853 | 56,693 | 17 | 0.00 |
| Bloomingdale, IL (1706587) | 22,018 | 22,083 | 22,185 | 22,249 | 22,328 | 22,299 | 216 | 1.00 |
| Blue Island, IL (1706704) | 23,706 | 23,724 | 23,789 | 23,824 | 23,846 | 23,785 | 61 | 0.30 |
| Bolingbrook, IL (1707133) | 73,366 | 73,482 | 73,783 | 73,978 | 74,007 | 74,180 | 698 | 0.90 |
| Bridgeview, IL (1708225) | 16,446 | 16,460 | 16,495 | 16,518 | 16,531 | 16,491 | 31 | 0.20 |
| Brookfield, IL (1708576) | 18,978 | 18,985 | 19,016 | 19,045 | 19,063 | 19,023 | 38 | 0.20 |
| Buffalo Grove, IL (1709447) | 41,496 | 41,466 | 41,568 | 41,595 | 41,715 | 41,701 | 235 | 0.60 |
| Burbank, IL (1709642) | 28,925 | 28,942 | 29,036 | 29,130 | 29,223 | 29,218 | 276 | 1.00 |
| Burr Ridge, IL (1709980) | 10,559 | 10,571 | 10,643 | 10,691 | 10,746 | 10,761 | 190 | 1.80 |
| Calumet City, IL (1710487) | 37,042 | 37,073 | 37,153 | 37,232 | 37,287 | 37,213 | 140 | 0.40 |
| Campton Hills, IL (1710906) | 11,131 | 11,123 | 11,209 | 11,256 | 11,304 | 11,317 | 194 | 1.70 |
| Carol Stream, IL (1711332) | 39,711 | 39,756 | 39,970 | 40,164 | 40,328 | 40,349 | 593 | 1.50 |
| Carpentersville, IL (1711358) | 37,691 | 37,759 | 38,069 | 38,162 | 38,277 | 38,407 | 648 | 1.70 |
| Cary, IL (1711592) | 18,271 | 18,281 | 18,177 | 18,121 | 18,021 | 17,991 | -290 | -1.60 |
| Cedar Lake, IN (1811062) | 11,560 | 11,588 | 11,660 | 11,654 | 11,708 | 11,854 | 266 | 2.30 |
| Channahon, IL (1712476) | 12,560 | 12,580 | 12,573 | 12,579 | 12,612 | 12,616 | 36 | 0.30 |
| Chesterton, IN (1812412) | 13,068 | 13,102 | 13,207 | 13,225 | 13,309 | 13,403 | 301 | 2.30 |
| Chicago, IL (1714000) | 2,695,598 | 2,697,319 | 2,705,627 | 2,715,415 | 2,722,307 | 2,722,389 | 25,070 | 0.90 |
| Chicago Heights, IL (1714026) | 30,276 | 30,335 | 30,394 | 30,451 | 30,500 | 30,436 | 101 | 0.30 |
| Chicago Ridge, IL (1714065) | 14,305 | 14,320 | 14,383 | 14,423 | 14,453 | 14,434 | 114 | 0.80 |
| Cicero, IL (1714351) | 83,891 | 84,271 | 84,395 | 84,513 | 84,577 | 84,354 | 83 | 0.10 |
| Country Club Hills, IL (1716691) | 16,541 | 16,555 | 16,602 | 16,847 | 16,885 | 16,865 | 310 | 1.90 |
| Crest Hill, IL (1717458) | 20,837 | 20,864 | 20,865 | 20,867 | 20,816 | 20,771 | -93 | -0.40 |
| Crestwood, IL (1717497) | 10,950 | 10,956 | 10,986 | 11,016 | 11,039 | 11,029 | 73 | 0.70 |
| Crown Point, IN (1816138) | 27,317 | 27,873 | 28,003 | 28,141 | 28,385 | 28,623 | 750 | 2.70 |
| Crystal Lake, IL (1717887) | 40,743 | 40,762 | 40,547 | 40,434 | 40,393 | 40,493 | -269 | -0.70 |
| Darien, IL (1718628) | 22,086 | 22,107 | 22,209 | 22,270 | 22,342 | 22,315 | 208 | 0.90 |
| DeKalb, IL (1719161) | 43,862 | 44,088 | 43,819 | 43,852 | 43,857 | 44,054 | -34 | -0.10 |
| Deerfield, IL (1718992) | 18,225 | 18,252 | 18,264 | 18,261 | 18,314 | 18,385 | 133 | 0.70 |
| Des Plaines, IL (1719642) | 58,364 | 58,425 | 58,637 | 58,849 | 58,985 | 58,947 | 522 | 0.90 |
| Dolton, IL (1720292) | 23,153 | 23,166 | 23,228 | 23,280 | 23,347 | 23,307 | 141 | 0.60 |
| Downers Grove, IL (1720591) | 47,833 | 48,917 | 49,163 | 49,359 | 49,651 | 49,715 | 798 | 1.60 |
| Dyer, IN (1819270) | 16,390 | 16,406 | 16,400 | 16,356 | 16,259 | 16,169 | -237 | -1.40 |
| East Chicago, IN (1819486) | 29,698 | 29,707 | 29,529 | 29,452 | 29,218 | 28,990 | -717 | -2.40 |
| Elgin, IL (1723074) | 108,188 | 108,304 | 109,243 | 109,749 | 110,240 | 111,117 | 2,813 | 2.60 |
| Elk Grove, IL (1723256) | 33,127 | 33,151 | 33,251 | 33,344 | 33,421 | 33,379 | 228 | 0.70 |
| Elmhurst, IL (1723620) | 44,121 | 44,184 | 44,915 | 45,147 | 45,567 | 45,751 | 1,567 | 3.50 |
| Elmwood Park, IL (1723724) | 24,883 | 24,893 | 24,940 | 24,983 | 25,010 | 24,954 | 61 | 0.20 |
| Evanston, IL (1724582) | 74,486 | 74,582 | 74,993 | 75,436 | 75,666 | 75,658 | 1,076 | 1.40 |
| Evergreen Park, IL (1724634) | 19,852 | 19,862 | 19,908 | 19,948 | 19,975 | 19,935 | 73 | 0.40 |
| Forest Park, IL (1726935) | 14,167 | 14,172 | 14,195 | 14,217 | 14,231 | 14,196 | 24 | 0.20 |
| Fox Lake, IL (1727442) | 10,579 | 10,632 | 10,598 | 10,578 | 10,588 | 10,578 | -54 | -0.50 |
| Frankfort, IL (1727624) | 17,782 | 17,848 | 17,945 | 18,056 | 18,212 | 18,446 | 598 | 3.40 |
| Franklin Park, IL (1727702) | 18,333 | 18,340 | 18,379 | 18,416 | 18,441 | 18,404 | 64 | 0.30 |
| Gary, IN (1827000) | 80,294 | 80,243 | 79,688 | 79,147 | 78,507 | 77,909 | -2,334 | -2.90 |
| Geneva, IL (1728872) | 21,495 | 21,518 | 21,645 | 21,692 | 21,707 | 21,742 | 224 | 1.00 |
| Glen Ellyn, IL (1729756) | 27,450 | 27,393 | 27,528 | 27,630 | 27,758 | 27,763 | 370 | 1.40 |
| Glendale Heights, IL (1729730) | 34,208 | 34,242 | 34,395 | 34,482 | 34,592 | 34,530 | 288 | 0.80 |
| Glenview, IL (1729938) | 44,692 | 44,735 | 44,877 | 45,035 | 45,456 | 46,767 | 2,032 | 4.50 |
| Grayslake, IL (1731121) | 20,957 | 20,897 | 20,848 | 20,990 | 21,026 | 21,018 | 121 | 0.60 |
| Griffith, IN (1830042) | 16,893 | 16,890 | 16,810 | 16,713 | 16,609 | 16,516 | -374 | -2.20 |
| Gurnee, IL (1732018) | 31,295 | 31,258 | 31,188 | 31,149 | 31,212 | 31,207 | -51 | -0.20 |
| Hammond, IN (1831000) | 80,830 | 80,752 | 80,194 | 79,641 | 78,991 | 78,384 | -2,368 | -2.90 |
| Hanover Park, IL (1732746) | 37,973 | 37,985 | 38,187 | 38,335 | 38,484 | 38,476 | 491 | 1.30 |
| Harvey, IL (1733383) | 25,282 | 25,292 | 25,336 | 25,379 | 25,406 | 25,347 | 55 | 0.20 |
| Hazel Crest, IL (1733695) | 14,100 | 14,109 | 14,146 | 14,180 | 14,203 | 14,182 | 73 | 0.50 |
| Hickory Hills, IL (1734514) | 14,049 | 14,061 | 14,099 | 14,138 | 14,183 | 14,177 | 116 | 0.80 |
| Highland, IN (1833466) | 23,727 | 23,713 | 23,572 | 23,436 | 23,273 | 23,127 | -586 | -2.50 |
| Highland Park, IL (1734722) | 29,763 | 29,767 | 29,764 | 29,819 | 29,876 | 29,871 | 104 | 0.30 |
| Hinsdale, IL (1735307) | 16,816 | 16,838 | 16,988 | 17,117 | 17,266 | 17,446 | 608 | 3.60 |
| Hobart, IN (1834114) | 29,059 | 29,335 | 29,174 | 28,998 | 28,803 | 28,635 | -700 | -2.40 |
| Hoffman Estates, IL (1735411) | 51,895 | 51,937 | 52,118 | 52,273 | 52,398 | 52,347 | 410 | 0.80 |
| Homer Glen, IL (1735835) | 24,220 | 24,263 | 24,307 | 24,346 | 24,336 | 24,364 | 101 | 0.40 |
| Homewood, IL (1735879) | 19,323 | 19,338 | 19,380 | 19,425 | 19,459 | 19,464 | 126 | 0.70 |
| Huntley, IL (1736750) | 24,291 | 24,347 | 24,514 | 24,789 | 25,258 | 25,603 | 1,256 | 5.20 |
| Joliet, IL (1738570) | 147,433 | 147,677 | 147,895 | 148,237 | 148,017 | 147,928 | 251 | 0.20 |
| Justice, IL (1738830) | 12,926 | 12,934 | 12,992 | 13,021 | 13,043 | 13,022 | 88 | 0.70 |
| Kenosha, WI (5539225) | 99,218 | 99,321 | 99,525 | 99,926 | 99,855 | 99,894 | 573 | 0.60 |
| La Grange, IL (1740767) | 15,550 | 15,566 | 15,625 | 15,684 | 15,747 | 15,759 | 193 | 1.20 |
| La Grange Park, IL (1740793) | 13,579 | 13,587 | 13,618 | 13,648 | 13,670 | 13,665 | 78 | 0.60 |
| Lake Forest, IL (1741105) | 19,375 | 19,392 | 19,352 | 19,333 | 19,372 | 19,379 | -13 | -0.10 |
| Lake Station, IN (1841535) | 12,572 | 12,561 | 12,472 | 12,381 | 12,274 | 12,175 | -386 | -3.10 |
| Lake Zurich, IL (1741742) | 19,631 | 19,702 | 19,669 | 19,920 | 20,003 | 20,054 | 352 | 1.80 |
| Lake in the Hills, IL (1741183) | 28,965 | 28,993 | 28,846 | 29,067 | 28,920 | 28,893 | -100 | -0.30 |
| Lansing, IL (1742028) | 28,331 | 28,391 | 28,458 | 28,523 | 28,571 | 28,522 | 131 | 0.50 |
| Lemont, IL (1742795) | 16,000 | 16,112 | 16,243 | 16,357 | 16,522 | 16,661 | 549 | 3.40 |
| Libertyville, IL (1743250) | 20,315 | 20,343 | 20,321 | 20,341 | 20,454 | 20,512 | 169 | 0.80 |
| Lincolnwood, IL (1743744) | 12,590 | 12,597 | 12,627 | 12,664 | 12,698 | 12,687 | 90 | 0.70 |
| Lindenhurst, IL (1743770) | 14,462 | 14,405 | 14,369 | 14,369 | 14,431 | 14,468 | 63 | 0.40 |
| Lisle, IL (1743939) | 22,390 | 22,471 | 22,581 | 22,659 | 22,746 | 22,827 | 356 | 1.60 |
| Lockport, IL (1744225) | 24,839 | 24,933 | 25,015 | 25,084 | 25,103 | 25,119 | 186 | 0.70 |
| Lombard, IL (1744407) | 43,165 | 43,436 | 43,621 | 43,740 | 43,897 | 43,893 | 457 | 1.10 |
| Lyons, IL (1745434) | 10,729 | 10,735 | 10,756 | 10,777 | 10,793 | 10,773 | 38 | 0.40 |
| Markham, IL (1747007) | 12,508 | 12,521 | 12,580 | 12,631 | 12,679 | 12,688 | 167 | 1.30 |
| Matteson, IL (1747540) | 19,009 | 19,020 | 19,087 | 19,136 | 19,170 | 19,156 | 136 | 0.70 |
| Maywood, IL (1747774) | 24,090 | 24,100 | 24,138 | 24,174 | 24,195 | 24,133 | 33 | 0.10 |
| McHenry, IL (1745694) | 26,992 | 27,019 | 26,875 | 26,801 | 26,674 | 26,630 | -389 | -1.40 |
| Melrose Park, IL (1748242) | 25,411 | 25,428 | 25,480 | 25,534 | 25,576 | 25,511 | 83 | 0.30 |
| Merrillville, IN (1848528) | 35,246 | 34,975 | 35,273 | 35,314 | 35,316 | 35,450 | 475 | 1.40 |
| Midlothian, IL (1748892) | 14,819 | 14,829 | 14,864 | 14,902 | 14,933 | 14,911 | 82 | 0.60 |
| Minooka, IL (1749607) | 10,924 | 10,949 | 10,986 | 11,073 | 11,112 | 11,194 | 245 | 2.20 |
| Mokena, IL (1749854) | 18,740 | 18,780 | 18,908 | 19,030 | 19,182 | 19,447 | 667 | 3.60 |
| Montgomery, IL (1750218) | 18,438 | 18,450 | 18,753 | 18,969 | 19,162 | 19,301 | 851 | 4.60 |
| Morris, IL (1750491) | 13,636 | 13,656 | 13,693 | 13,793 | 13,897 | 14,135 | 479 | 3.50 |
| Morton Grove, IL (1750647) | 23,270 | 23,294 | 23,375 | 23,474 | 23,530 | 23,497 | 203 | 0.90 |
| Mount Prospect, IL (1751089) | 54,167 | 54,283 | 54,432 | 54,578 | 54,785 | 54,951 | 668 | 1.20 |
| Mundelein, IL (1751349) | 31,064 | 31,066 | 31,115 | 31,155 | 31,354 | 31,562 | 496 | 1.60 |
| Munster, IN (1851912) | 23,603 | 23,560 | 23,446 | 23,346 | 23,210 | 23,103 | -457 | -1.90 |
| Naperville, IL (1751622) | 141,853 | 142,300 | 142,994 | 143,779 | 144,782 | 146,128 | 3,828 | 2.70 |
| New Lenox, IL (1752584) | 24,394 | 24,430 | 24,495 | 24,685 | 24,972 | 25,426 | 996 | 4.10 |
| Niles, IL (1753000) | 29,803 | 29,824 | 29,904 | 29,978 | 30,034 | 30,000 | 176 | 0.60 |
| Norridge, IL (1753377) | 14,572 | 14,582 | 14,618 | 14,662 | 14,694 | 14,674 | 92 | 0.60 |
| North Aurora, IL (1753442) | 16,760 | 16,757 | 16,888 | 16,963 | 17,105 | 17,342 | 585 | 3.50 |
| North Chicago, IL (1753559) | 32,574 | 32,584 | 29,745 | 30,062 | 30,415 | 30,395 | -2,189 | -6.70 |
| Northbrook, IL (1753481) | 33,170 | 33,206 | 33,348 | 33,479 | 33,607 | 33,655 | 449 | 1.40 |
| Northlake, IL (1753871) | 12,323 | 12,333 | 12,356 | 12,379 | 12,395 | 12,372 | 39 | 0.30 |
| Oak Forest, IL (1754638) | 27,962 | 27,983 | 28,070 | 28,148 | 28,209 | 28,174 | 191 | 0.70 |
| Oak Lawn, IL (1754820) | 56,690 | 56,723 | 56,871 | 57,007 | 57,116 | 57,034 | 311 | 0.50 |
| Oak Park, IL (1754885) | 51,878 | 51,895 | 51,955 | 52,009 | 52,161 | 52,008 | 113 | 0.20 |
| Orland Park, IL (1756640) | 56,767 | 56,735 | 57,011 | 57,274 | 58,546 | 58,666 | 1,931 | 3.40 |
| Oswego, IL (1756887) | 30,355 | 30,534 | 31,103 | 31,669 | 32,193 | 33,099 | 2,565 | 8.40 |
| Palatine, IL (1757225) | 68,557 | 68,608 | 68,841 | 69,114 | 69,352 | 69,387 | 779 | 1.10 |
| Palos Heights, IL (1757381) | 12,515 | 12,522 | 12,558 | 12,591 | 12,614 | 12,597 | 75 | 0.60 |
| Palos Hills, IL (1757394) | 17,484 | 17,497 | 17,552 | 17,601 | 17,642 | 17,627 | 130 | 0.70 |
| Park Forest, IL (1757732) | 21,975 | 21,986 | 22,022 | 22,057 | 22,080 | 22,034 | 48 | 0.20 |
| Park Ridge, IL (1757875) | 37,480 | 37,515 | 37,609 | 37,739 | 37,872 | 37,856 | 341 | 0.90 |
| Plainfield, IL (1760287) | 39,581 | 39,950 | 40,145 | 40,451 | 41,784 | 42,138 | 2,188 | 5.50 |
| Plano, IL (1760352) | 10,856 | 10,891 | 10,981 | 11,054 | 11,107 | 11,175 | 284 | 2.60 |
| Pleasant Prairie, WI (5563300) | 19,719 | 19,740 | 19,825 | 19,946 | 20,150 | 20,400 | 660 | 3.30 |
| Portage, IN (1861092) | 36,828 | 36,838 | 36,931 | 36,851 | 36,827 | 36,760 | -78 | -0.20 |
| Prospect Heights, IL (1762016) | 16,256 | 16,267 | 16,313 | 16,361 | 16,401 | 16,418 | 151 | 0.90 |
| Richton Park, IL (1763706) | 13,646 | 13,657 | 13,697 | 13,736 | 13,767 | 13,751 | 94 | 0.70 |
| River Forest, IL (1764304) | 11,172 | 11,178 | 11,197 | 11,218 | 11,230 | 11,208 | 30 | 0.30 |
| River Grove, IL (1764343) | 10,227 | 10,233 | 10,256 | 10,276 | 10,290 | 10,271 | 38 | 0.40 |
| Riverdale, IL (1764278) | 13,549 | 13,560 | 13,587 | 13,614 | 13,632 | 13,604 | 44 | 0.30 |
| Rolling Meadows, IL (1765338) | 24,099 | 24,111 | 24,178 | 24,245 | 24,292 | 24,279 | 168 | 0.70 |
| Romeoville, IL (1765442) | 39,680 | 39,668 | 39,695 | 39,730 | 39,687 | 39,679 | 11 | 0.00 |
| Roselle, IL (1765806) | 22,763 | 22,774 | 22,875 | 22,941 | 23,033 | 23,030 | 256 | 1.10 |
| Round Lake, IL (1766027) | 18,289 | 18,345 | 18,343 | 18,393 | 18,468 | 18,536 | 191 | 1.00 |
| Round Lake Beach, IL (1766040) | 28,175 | 28,127 | 28,050 | 27,997 | 28,037 | 28,012 | -115 | -0.40 |
| Sauk, IL (1767769) | 10,506 | 10,511 | 10,534 | 10,553 | 10,566 | 10,545 | 34 | 0.30 |
| Schaumburg, IL (1768003) | 74,227 | 74,282 | 74,507 | 74,729 | 74,906 | 74,896 | 614 | 0.80 |
| Schererville, IN (1868220) | 29,243 | 29,236 | 29,180 | 29,058 | 28,972 | 28,926 | -310 | -1.10 |
| Schiller Park, IL (1768081) | 11,793 | 11,800 | 11,830 | 11,858 | 11,878 | 11,857 | 57 | 0.50 |
| Shorewood, IL (1769758) | 15,615 | 15,692 | 16,029 | 16,198 | 16,362 | 16,569 | 877 | 5.60 |
| Skokie, IL (1770122) | 64,784 | 64,824 | 64,972 | 65,119 | 65,223 | 65,112 | 288 | 0.40 |
| South Elgin, IL (1770720) | 21,985 | 22,011 | 22,138 | 22,186 | 22,201 | 22,226 | 215 | 1.00 |
| South Holland, IL (1770850) | 22,030 | 22,044 | 22,095 | 22,145 | 22,180 | 22,144 | 100 | 0.50 |
| St. Charles, IL (1766703) | 32,974 | 32,983 | 33,174 | 33,257 | 33,291 | 33,387 | 404 | 1.20 |
| St. John, IN (1866852) | 14,850 | 14,926 | 15,162 | 15,311 | 15,652 | 16,117 | 1,191 | 8.00 |
| Streamwood, IL (1773157) | 39,858 | 39,924 | 40,067 | 40,226 | 40,347 | 40,345 | 421 | 1.10 |
| Summit, IL (1773638) | 11,054 | 11,059 | 11,427 | 11,448 | 11,472 | 11,447 | 388 | 3.50 |
| Sycamore, IL (1774223) | 17,519 | 17,515 | 17,427 | 17,479 | 17,543 | 17,753 | 238 | 1.40 |
| Tinley Park, IL (1775484) | 56,703 | 56,789 | 56,967 | 57,149 | 57,284 | 57,280 | 491 | 0.90 |
| Valparaiso, IN (1878326) | 31,730 | 31,777 | 31,953 | 32,019 | 32,209 | 32,369 | 592 | 1.90 |
| Vernon Hills, IL (1777694) | 25,113 | 25,050 | 25,561 | 25,533 | 25,622 | 25,911 | 861 | 3.40 |
| Villa Park, IL (1777993) | 21,904 | 21,922 | 22,002 | 22,046 | 22,097 | 22,038 | 116 | 0.50 |
| Warrenville, IL (1778929) | 13,140 | 13,188 | 13,246 | 13,283 | 13,348 | 13,336 | 148 | 1.10 |
| Wauconda, IL (1779267) | 13,603 | 13,665 | 13,717 | 13,762 | 13,868 | 13,896 | 231 | 1.70 |
| Waukegan, IL (1779293) | 89,078 | 89,155 | 88,940 | 88,782 | 88,940 | 88,915 | -240 | -0.30 |
| West Chicago, IL (1780060) | 27,086 | 27,227 | 27,362 | 27,448 | 27,543 | 27,507 | 280 | 1.00 |
| Westchester, IL (1780047) | 16,718 | 16,728 | 16,768 | 16,807 | 16,836 | 16,807 | 79 | 0.50 |
| Western Springs, IL (1780242) | 12,975 | 12,989 | 13,050 | 13,111 | 13,184 | 13,284 | 295 | 2.30 |
| Westmont, IL (1780645) | 24,685 | 24,683 | 24,791 | 24,858 | 24,961 | 24,963 | 280 | 1.10 |
| Wheaton, IL (1781048) | 52,894 | 53,024 | 53,274 | 53,420 | 53,627 | 53,644 | 620 | 1.20 |
| Wheeling, IL (1781087) | 37,648 | 37,684 | 37,809 | 37,915 | 38,024 | 38,010 | 326 | 0.90 |
| Wilmette, IL (1782075) | 27,087 | 27,107 | 27,215 | 27,304 | 27,397 | 27,446 | 339 | 1.30 |
| Winnetka, IL (1782530) | 12,187 | 12,202 | 12,302 | 12,368 | 12,443 | 12,490 | 288 | 2.40 |
| Wood Dale, IL (1782985) | 13,770 | 13,783 | 13,855 | 13,898 | 13,967 | 13,945 | 162 | 1.20 |
| Woodridge, IL (1783245) | 32,971 | 33,000 | 33,159 | 33,256 | 33,387 | 33,378 | 378 | 1.10 |
| Woodstock, IL (1783349) | 24,770 | 24,843 | 24,938 | 25,057 | 25,153 | 25,178 | 335 | 1.30 |
| Worth, IL (1783518) | 10,789 | 10,798 | 10,820 | 10,844 | 10,860 | 10,838 | 40 | 0.40 |
| Yorkville, IL (1784038) | 16,921 | 17,007 | 17,253 | 17,488 | 17,760 | 18,096 | 1,089 | 6.40 |
| Zion, IL (1784220) | 24,413 | 24,365 | 24,317 | 24,267 | 24,295 | 24,264 | -101 | -0.40 |
All places time series population estimates interactive table.
4.2. Component County Characteristics go top
Updated periodically, annually. General demographics, social characteristics and extended detail Available in subscription edition.
Metropolitan areas are defined as one or more contiguous counties based on a set of demographic-economic criteria. Counties comprising the metro are shown below. For multi-county metros, this section provides insights into how the population is changing by county. Many metros changed geographic composition (counties included in the metro) between the Census 2010 vintage and the current vintage. These changes, if any, are also shown below (county is marked with **). See projections in related section.Click county code link to view county components of change.
All counties interactive tables General Demographics | Social | Economic | HousingMetropolitan areas are defined as one or more contiguous counties based on a set of demographic-economic criteria. Counties comprising the metro are shown below. For multi-county metros, this section provides insights into how the population is changing by county. Many metros changed geographic composition (counties included in the metro) between the Census 2010 vintage and the current vintage. These changes, if any, are also shown below (county is marked with **). See projections in related section.Click county code link to view county components of change.
| Area | July 1 2010 | Pct | July 1 2011 | Pct | July 1 2012 | Pct | July 1 2013 | Pct | July 1 2014 | Pct | July 1 2015 | Pct |
| Metro Summary ... more details | 9,471,357 | 100.0 | 9,495,578 | 100.0 | 9,520,766 | 100.0 | 9,545,362 | 100.0 | 9,557,294 | 100.0 | 9,551,031 | 100.0 |
| Cook County, IL (17031) | 5,199,303 | 54.9 | 5,215,623 | 54.9 | 5,232,690 | 55.0 | 5,246,731 | 55.0 | 5,248,704 | 54.9 | 5,238,216 | 54.8 |
| DeKalb County, IL (17037) | 105,177 | 1.1 | 104,364 | 1.1 | 104,261 | 1.1 | 104,055 | 1.1 | 104,693 | 1.1 | 104,352 | 1.1 |
| DuPage County, IL (17043) | 918,145 | 9.7 | 924,462 | 9.7 | 927,997 | 9.7 | 932,096 | 9.8 | 933,769 | 9.8 | 933,736 | 9.8 |
| Grundy County, IL (17063) | 50,120 | 0.5 | 50,068 | 0.5 | 50,170 | 0.5 | 50,172 | 0.5 | 50,433 | 0.5 | 50,541 | 0.5 |
| Kane County, IL (17089) | 516,069 | 5.4 | 519,940 | 5.5 | 521,840 | 5.5 | 524,302 | 5.5 | 527,501 | 5.5 | 530,847 | 5.6 |
| Kendall County, IL (17093) | 115,303 | 1.2 | 116,809 | 1.2 | 118,360 | 1.2 | 119,838 | 1.3 | 121,816 | 1.3 | 123,355 | 1.3 |
| Lake County, IL (17097) | 704,294 | 7.4 | 701,094 | 7.4 | 701,494 | 7.4 | 703,841 | 7.4 | 704,149 | 7.4 | 703,910 | 7.4 |
| McHenry County, IL (17111) | 309,119 | 3.3 | 307,815 | 3.2 | 307,610 | 3.2 | 307,043 | 3.2 | 306,975 | 3.2 | 307,343 | 3.2 |
| Will County, IL (17197) | 678,910 | 7.2 | 680,667 | 7.2 | 682,369 | 7.2 | 684,054 | 7.2 | 685,621 | 7.2 | 687,263 | 7.2 |
| Jasper County, IN (18073) | 33,514 | 0.4 | 33,415 | 0.4 | 33,478 | 0.4 | 33,412 | 0.4 | 33,464 | 0.4 | 33,470 | 0.4 |
| Lake County, IN (18089) | 495,987 | 5.2 | 494,788 | 5.2 | 493,192 | 5.2 | 491,560 | 5.1 | 490,574 | 5.1 | 487,865 | 5.1 |
| Newton County, IN (18111) | 14,240 | 0.2 | 14,115 | 0.1 | 14,062 | 0.1 | 14,029 | 0.1 | 14,072 | 0.1 | 14,008 | 0.1 |
| Porter County, IN (18127) | 164,550 | 1.7 | 165,510 | 1.7 | 165,765 | 1.7 | 166,578 | 1.7 | 167,308 | 1.8 | 167,688 | 1.8 |
| Kenosha County, WI (55059) | 166,626 | 1.8 | 166,908 | 1.8 | 167,478 | 1.8 | 167,651 | 1.8 | 168,215 | 1.8 | 168,437 | 1.8 |
All counties population estimates & components of change time series interactive table.
4.2.1. RDEMS County Characteristics
Updated quarterly. For more information, see RDEMS Main.
Links open HSG1 Housing & New Residential Construction section. Select other sections from list above table.
Cook County, IL
DeKalb County, IL
DuPage County, IL
Kane County, IL
Kendall County, IL
Lake County, IL
McHenry County, IL
Will County, IL
Lake County, IN
Porter County, IN
Kenosha County, WI
DeKalb County, IL
DuPage County, IL
Kane County, IL
Kendall County, IL
Lake County, IL
McHenry County, IL
Will County, IL
Lake County, IN
Porter County, IN
Kenosha County, WI
4.3. General Demographic Characteristics
Updated annually. For more information, detail & to compare areas use interactive table.
| Item | 2013 | 2014 | Change 2013-14 | %Change 2013-14 |
| Total Population: Race/Origin | 9,537,040 | 9,553,810 | 16,770 | 0.18 |
| One race | 9,321,509 | 9,332,821 | 11,312 | 0.12 |
| White | 6,370,042 | 6,332,643 | -37,399 | -0.59 |
| Black/African American | 6,370,042 | 6,332,643 | -37,399 | -0.59 |
| American Indian/Alaska Native | 22,233 | 22,934 | 701 | 3.15 |
| Asian alone | 575,210 | 603,681 | 28,471 | 4.95 |
| Native Hawaiian/Pacific Islander | 3,790 | 3,132 | -658 | -17.36 |
| Some other race alone | 740,098 | 761,554 | 21,456 | 2.90 |
| Two or more races | 215,531 | 220,989 | 5,458 | 2.53 |
| Hispanic or Latino (of any race) | 2,042,355 | 2,072,324 | 29,969 | 1.47 |
| Population 25 years and over | 6,334,694 | 6,386,509 | 51,815 | 1.47 |
| % high school graduate or higher | 87.2 | 87.5 | 0.3 | 0.34 |
| % bachelor's degree or higher | 35.1 | 36.1 | 1.0 | 2.85 |
| Total Households | 3,450,331 | 3,442,174 | -8,157 | 2.85 |
| Median household income ($) | 60,564 | 61,598 | 1,034 | 1.71 |
| Mean household income ($) | 83,898 | 85,507 | 1,609 | 1.92 |
| Item | 2013 | 2014 | Change 2013-14 | %Change 2013-14 |
| Total Population: Gender & Age | 9,537,040 | 9,553,810 | 16,770 | 0.18 |
| Male | 4,664,964 | 4,671,706 | 6,742 | 1.92 |
| Female | 4,872,076 | 4,882,104 | 10,028 | 1.92 |
| Under 5 years | 605,793 | 600,024 | -5,769 | 1.92 |
| 5 to 9 years | 642,302 | 623,144 | -19,158 | -2.98 |
| 10 to 14 years | 648,438 | 648,675 | 237 | 0.04 |
| 15 to 19 years | 654,198 | 645,633 | -8,565 | -1.31 |
| 20 to 24 years | 651,615 | 649,825 | -1,790 | -0.27 |
| 25 to 34 years | 1,372,480 | 1,371,010 | -1,470 | -0.11 |
| 35 to 44 years | 1,293,837 | 1,297,514 | 3,677 | 0.28 |
| 45 to 54 years | 1,338,662 | 1,325,973 | -12,689 | -0.95 |
| 55 to 59 years | 625,222 | 638,191 | 12,969 | 2.07 |
| 55 to 59 years | 625,222 | 638,191 | 12,969 | 2.07 |
| 60 to 64 years | 519,877 | 534,249 | 14,372 | 2.76 |
| 65 to 74 years | 666,321 | 696,858 | 30,537 | 4.58 |
| 75 to 84 years | 354,342 | 357,188 | 2,846 | 0.80 |
| 85 years and over | 163,953 | 165,526 | 1,573 | 0.96 |
| Median age | 36.5 | 36.8 | 0.3 | 0.82 |
| 18 years and over | 7,242,304 | 7,287,740 | 45,436 | 0.63 |
| 21 years and over | 6,856,274 | 6,907,898 | 51,624 | 0.75 |
| 62 years and over | 1,475,930 | 1,521,774 | 45,844 | 3.11 |
| 65 years and over | 1,184,616 | 1,219,572 | 34,956 | 2.95 |
5. Housing Characteristics & Trends go top
Updated monthly, quarterly, annually. Housing market conditions and extended detail Available in subscription edition.
5.1. Total Housing Units
Updated Annually. Independent annual model-based estimates. For more information, detail & to compare areas use interactive table.
| Item | Census 2010 | July 1 2010 | July 1 2011 | July 1 2012 | July 1 2013 | July 1 2014 | Change 2010-2014 | %Change 2010-2014 |
| Total Housing Units | 3,797,247 | 3,796,959 | 3,796,886 | 3,797,191 | 3,799,307 | 3,803,716 | 6,757 | 0.18 |
5.2. General Housing Characteristics
Updated Annually. For more information, detail & to compare areas use interactive table.
| Item | 2013 | 2014 | Change 2013-14 | %Change 2013-14 |
| Housing Units: Units in Structure | 3,791,588 | 3,803,831 | 12,243 | 0.32 |
| 1-unit, detached | 1,977,978 | 1,991,748 | 13,770 | 0.70 |
| 1-unit, attached | 277,031 | 273,247 | -3,784 | -1.37 |
| 2 units | 257,637 | 260,821 | 3,184 | 1.24 |
| 3 or 4 units | 295,916 | 289,417 | -6,499 | -2.20 |
| 5 to 9 units | 286,304 | 290,430 | 4,126 | 1.44 |
| 10 to 20 units | 180,790 | 170,759 | -10,031 | -5.55 |
| 20 or more units | 480,038 | 490,159 | 10,121 | 2.11 |
| Item | 2013 | 2014 | Change 2013-14 | %Change 2013-14 |
| Housing Units: Occupancy & Tenure | 3,791,588 | 3,803,831 | 12,243 | 0.32 |
| Occupied Housing Units | 3,450,331 | 3,442,174 | -8,157 | -0.24 |
| Owner | 2,211,699 | 2,202,845 | -8,854 | -0.40 |
| Renter | 1,238,632 | 1,239,329 | 697 | 0.06 |
| Vacant Housing Units | 341,257 | 361,657 | 20,400 | 5.98 |
| Homeowner vacancy rate | 1.90 | 2.10 | 0.20 | ... |
| Rental vacancy rate | 5.60 | 6.30 | 0.70 | ... |
| Average household size; owner-occ | 2.84 | 2.85 | 0.01 | 0.35 |
| Average household size; renter-occ | 2.50 | 2.52 | 0.02 | 0.80 |
| Median Value $ owner occupied | 206,300 | 211,800 | 5,500 | 2.67 |
| Median Rent $ renter occupied | 959 | 990 | 31 | 3.23 |
5.3. Residential Construction; Housing Units Authorized & Value
Updated Monthly. 12 most recent months. For more information, detail & to compare areas use interactive table.
| Item | Aug15 | Sep15 | Oct15 | Nov15 | Dec15 | Jan16 | Feb16 | Mar16 | Apr16 | May16 | Jun16 | Jul16 |
| Total Residential Units | 1,578 | 1,116 | 1,370 | 2,166 | 1,118 | 1,655 | 1,017 | 1,911 | 1,069 | 1,482 | 996 | 1,997 |
| in 1 unit bldgs | 721 | 690 | 784 | 628 | 488 | 374 | 412 | 716 | 753 | 737 | 790 | 709 |
| in 2 unit bldgs | 18 | 28 | 40 | 12 | 20 | 8 | 0 | 16 | 24 | 10 | 20 | 22 |
| in 3-4 unit bldgs | 37 | 86 | 157 | 53 | 80 | 26 | 38 | 46 | 43 | 30 | 42 | 80 |
| in 5+ unit bldgs | 802 | 312 | 389 | 1,473 | 530 | 1,247 | 567 | 1,133 | 249 | 705 | 144 | 1,186 |
| Bldgs with 5+ units | 17 | 24 | 28 | 38 | 21 | 32 | 15 | 35 | 26 | 24 | 16 | 21 |
| Percent Coverage | 100 | 100 | 100 | 100 | 100 | 100 | 100 | 100 | 100 | 100 | 100 | 100 |
| Value ($000), Total Units | 311,580 | 253,311 | 312,242 | 696,489 | 230,637 | 432,981 | 177,925 | 289,150 | 252,017 | 311,305 | 251,742 | 335,319 |
| 1 unit structures | 193,667 | 201,328 | 227,463 | 193,711 | 148,736 | 121,846 | 119,407 | 213,817 | 207,499 | 220,555 | 221,687 | 234,150 |
| 2 unit structures | 2,420 | 3,913 | 4,036 | 3,519 | 3,442 | 1,553 | 0 | 3,917 | 3,826 | 1,585 | 3,489 | 4,102 |
| 3-4 unit structures | 5,584 | 9,353 | 22,083 | 10,083 | 12,781 | 5,584 | 8,071 | 8,036 | 6,916 | 5,885 | 7,294 | 10,878 |
| 5+ unit structures | 109,909 | 38,717 | 58,660 | 489,176 | 65,678 | 303,998 | 50,447 | 63,380 | 33,776 | 83,280 | 19,272 | 86,189 |
5.4. Housing Price Index go top
Updated quarterly. All transactions; not seasonally adjusted. See related Housing Price Index (HPI) interactive table.
See related 5-Digit ZIP Code HPI interactive table.
| Housing Price Index: | 2015Q3 | 2015Q4 | 2016Q1 | 2016Q2 | 2016Q3 |
| 166.46 | 167.92 | 168.20 | 171.02 | 172.86 | |
| Quarter-to-Quarter/Year Percent Change: | 2015Q3-2015Q4 | 2015Q4-2016Q1 | 2016Q1-2016Q2 | 2016Q2-2016Q3 | 2015Q3-2016Q3 |
| 0.88 | 0.17 | 1.68 | 1.08 | 3.84 |
6.1. Economic Profile go top
The Economic Profile shows shows derivation and key components of total personal income. Data are organized by place of residence and place of work. The place of residence profile includes estimates of total personal income, population, and per capita personal income. The place of work profile includes estimates of total earnings, total employment and average earnings per job. Updated annually. See related interactive table.
Dollar items are in current dollars (not adjusted for inflation). Per capita items in dollars; other dollar items in thousands of dollars.
See related notes.
| Item | 2011 | 2012 | 2013 | 2014 | 2015 | Change 2011-2015 | %Change 2011-2015 |
| Personal income | 434,962,900 | 459,669,792 | 468,263,079 | 493,128,836 | 514,662,122 | 79,699,222 | 18.3 |
| Net earnings 1/ | 289,951,866 | 305,708,696 | 312,870,384 | 328,599,770 | 344,467,144 | 54,515,278 | 18.8 |
| Personal current transfer receipts | 64,193,603 | 64,505,092 | 67,054,598 | 68,090,708 | 71,572,567 | 7,378,964 | 11.5 |
| Income maintenance 2/ | 7,992,442 | 8,206,011 | 8,367,400 | 8,243,925 | 8,231,374 | 238,932 | 3.0 |
| Unemployment insurance compensation | 4,019,602 | 3,061,785 | 2,548,292 | 1,456,804 | 1,267,982 | -2,751,620 | -68.5 |
| Retirement and other | 52,181,559 | 53,237,296 | 56,138,906 | 58,389,979 | 62,073,211 | 9,891,652 | 19.0 |
| Dividends, interest, and rent 3/ | 80,817,431 | 89,456,004 | 88,338,097 | 96,438,358 | 98,622,411 | 17,804,980 | 22.0 |
| Population 4/ | 9,495,578 | 9,520,766 | 9,545,362 | 9,557,294 | 9,551,031 | 55,453 | 0.6 |
| Per capita personal income | 45,807 | 48,281 | 49,057 | 51,597 | 53,886 | 8,079 | 17.6 |
| Per capita net earnings | 30,535 | 32,110 | 32,777 | 34,382 | 36,066 | 5,531 | 18.1 |
| Per capita personal current transfer receipts | 6,760 | 6,775 | 7,025 | 7,124 | 7,494 | 734 | 10.9 |
| Per capita income maintenance | 842 | 862 | 877 | 863 | 862 | 20 | 2.4 |
| Per capita unemployment insurance compensation | 423 | 322 | 267 | 152 | 133 | -290 | -68.6 |
| Per capita retirement and other | 5,495 | 5,592 | 5,881 | 6,109 | 6,499 | 1,004 | 18.3 |
| Per capita dividends, interest, and rent | 8,511 | 9,396 | 9,255 | 10,091 | 10,326 | 1,815 | 21.3 |
| Earnings by place of work | 324,670,213 | 342,173,497 | 354,448,271 | 371,743,508 | 389,394,714 | 64,724,501 | 19.9 |
| Wages and salaries | 244,650,106 | 255,558,852 | 261,043,411 | 272,072,107 | 287,142,721 | 42,492,615 | 17.4 |
| Supplements to wages and salaries | 56,728,314 | 58,997,133 | 59,728,574 | 59,971,270 | 61,470,209 | 4,741,895 | 8.4 |
| Employer cont. for empl. pension & insur. funds 6/ | 39,327,182 | 40,514,984 | 41,117,676 | 40,921,281 | 41,915,639 | 2,588,457 | 6.6 |
| Employer cont. for government social insurance | 17,401,132 | 18,482,149 | 18,610,898 | 19,049,989 | 19,554,570 | 2,153,438 | 12.4 |
| Proprietors' income | 23,291,793 | 27,617,512 | 33,676,286 | 39,700,131 | 40,781,784 | 17,489,991 | 75.1 |
| Nonfarm proprietors' income | 364,776 | 210,158 | 493,206 | 116,713 | -118,935 | -483,711 | -132.6 |
| Farm proprietors' income | 22,927,017 | 27,407,354 | 33,183,080 | 39,583,418 | 40,900,719 | 17,973,702 | 78.4 |
| Total full-time and part-time employment | 5,588,972 | 5,646,580 | 5,733,334 | 5,831,688 | 5,956,234 | 367,262 | 6.6 |
| Wage and salary jobs | 4,446,494 | 4,513,345 | 4,577,273 | 4,646,397 | 4,734,763 | 288,269 | 6.5 |
| Number of proprietors | 1,142,478 | 1,133,235 | 1,156,061 | 1,185,291 | 1,221,471 | 78,993 | 6.9 |
| Number of nonfarm proprietors 7/ | 5,647 | 5,409 | 5,480 | 5,484 | 5,424 | -223 | -3.9 |
| Number of farm proprietors | 1,136,831 | 1,127,826 | 1,150,581 | 1,179,807 | 1,216,047 | 79,216 | 7.0 |
| Average earnings per job (dollars) | 58,091 | 60,598 | 61,822 | 63,745 | 65,376 | 7,285 | 12.5 |
| Average wages and salaries | 55,021 | 56,623 | 57,030 | 58,556 | 60,646 | 5,625 | 10.2 |
| Average nonfarm proprietors' income | 20,167 | 24,301 | 28,840 | 33,551 | 33,634 | 13,467 | 66.8 |
See related notes.
6.2. Cost of Living Indexes go top
Updated periodically. Available in subscription edition.
6.3. Cost of Doing Business Indexes go top
Updated periodically. Available in subscription edition.
6.4. Consumer Price Index go top
Updated monthly. Available in subscription edition.
6.5. Gross Domestic Product by Sector go top
Updated quarterly, annually. For more information, detail & to compare areas use interactive table. Additional detail in subscription edition.
| Item | 2009 | 2010 | 2011 | 2012 | 2013 | 2014 | Change 2009-14 | %Change 2009-14 |
| Gross Domestic Product, millions of current dollars | 521,172 | 534,667 | 551,983 | 579,667 | 589,812 | 610,552 | 89,380 | 17.15 |
| Real Gross Domestic Product, millions of real dollars | 521,172 | 528,138 | 534,296 | 547,247 | 547,787 | 557,745 | 36,573 | 7.02 |
6.6. Establishments, Employment & Earnings by Detailed Type of Business go top
Updated quarterly. For more information, detail & to compare areas use interactive table.
| Sector | Establishments 2015Q1 | Employment 2015Q1 | Avg Weekly Wages 2015Q1 | Establishments 2015Q2 | Employment 2015Q2 | Avg Weekly Wages 2015Q2 |
| Total, all industries | 288,707 | 7,084,434 | 1,201 | 292,072 | 7,292,696 | 1,062 |
| Total, all industries - Fed Govt | 660 | 89,218 | 1,649 | 657 | 89,884 | 1,385 |
| Total, all industries - St Govt | 110 | 58,797 | 1,181 | 110 | 58,292 | 1,189 |
| Total, all industries - Local Govt | 2,605 | 712,963 | 1,003 | 2,603 | 734,372 | 1,078 |
| Total, all industries - Private | 285,332 | 6,223,456 | 1,218 | 288,702 | 6,410,148 | 1,055 |
| Goods-producing | 42,032 | 916,781 | 1,416 | 42,389 | 957,541 | 1,251 |
| Natural resources and mining | 686 | 8,592 | 890 | 685 | 11,475 | 846 |
| Construction | 27,897 | 228,378 | 1,273 | 28,199 | 264,253 | 1,316 |
| Manufacturing | 13,449 | 679,812 | 1,471 | 13,505 | 681,813 | 1,233 |
| Service-providing | 243,300 | 5,306,674 | 1,184 | 246,313 | 5,452,607 | 1,020 |
| Trade, transportation & utilities | 59,969 | 1,438,397 | 972 | 60,463 | 1,460,214 | 920 |
| Information | 4,254 | ... | ... | 4,245 | ... | ... |
| Financial activities | 27,467 | 454,023 | 2,902 | 27,595 | 456,511 | 1,772 |
| Professional & business services | 61,480 | 1,225,048 | 1,501 | 62,152 | 1,259,645 | 1,306 |
| Education and health services | 29,215 | 1,116,364 | 875 | 29,488 | 1,134,666 | 908 |
| Leisure and hospitality | 25,023 | 685,257 | 441 | 25,216 | 746,264 | 445 |
| Other services | 29,659 | ... | ... | 30,070 | ... | ... |
| Unclassified | 6,233 | 9,225 | 602 | 7,084 | 11,800 | 614 |
Notes: cell value of '...' indicates value suppressed to maintain confidentiality.
Use the following links to access detailed establishment and employment data by type of business (CSV files).
.. see notes on using these files.
2013Q1 .. 2013Q2 .. 2013Q3 .. 2013Q4 .|. 2014Q1 .. 2014Q2 .. 2014Q3 .. 2014Q4 .|. 2015Q1 .. 2015Q2 .. 2015Q3 .. 2015Q4 .. 2016Q1 .. 2016Q2
6.7. Labor Market Characteristics & Trends go top
Updated monthly. Available in subscription edition.
For more information, detail & to compare areas use interactive table.
Table shows 13 most recent months.
| Item | Aug15 | Sep15 | Oct15 | Nov15 | Dec15 | Jan16 | Feb16 | Mar16 | Apr16 | May16 | Jun16 | Jul16 | Aug16 |
| Unemplymnt Rate | 5.9 | 5.4 | 5.5 | 5.6 | 5.7 | 6.7 | 6.9 | 6.8 | 6.5 | 5.7 | 6.4 | 5.8 | 5.7 |
| Unemployment | 157,653 | 141,141 | 146,537 | 147,800 | 151,977 | 178,479 | 185,471 | 183,469 | 176,683 | 153,310 | 176,765 | 160,050 | 153,903 |
| Employment | 2,500,287 | 2,485,064 | 2,496,810 | 2,492,756 | 2,494,593 | 2,469,308 | 2,500,849 | 2,525,819 | 2,531,629 | 2,542,126 | 2,569,156 | 2,581,095 | 2,538,904 |
| Labor Force | 2,657,940 | 2,626,205 | 2,643,347 | 2,640,556 | 2,646,570 | 2,647,787 | 2,686,320 | 2,709,288 | 2,708,312 | 2,695,436 | 2,745,921 | 2,741,145 | 2,692,807 |
7. Education Infrastructure go top
7.1. Component School District Characteristics go top
Districts in this metro. Updated periodically. See related School District interactive table.
| District Name | City Name | District Code | Locale Code | County | State | 2012-13 Enrollment | 2013 Total Population | Grade Relevant Pop Ages 5-17 |
| Addison Sd 4 | Addison | 1703150 | 21 | 17043 | IL | 4,361 | 37,929 | 4,557 |
| Adlai E Stevenson Hsd 125 | Lincolnshire | 1732580 | 21 | 17097 | IL | 3,947 | 61,168 | 4,384 |
| Alden Hebron Sd 19 | Hebron | 1703300 | 42 | 17111 | IL | 444 | 3,081 | 499 |
| Alsip-Hazlgrn-Oaklwn Sd 126 | Alsip | 1703480 | 21 | 17031 | IL | 1,559 | 17,105 | 1,809 |
| Antioch Ccsd 34 | Antioch | 1703840 | 21 | 17097 | IL | 3,101 | 23,846 | 3,362 |
| Aptakisic-Tripp Ccsd 102 | Buffalo Grove | 1703900 | 21 | 17097 | IL | 2,044 | 18,698 | 1,940 |
| Arbor Park Sd 145 | Oak Forest | 1703930 | 21 | 17031 | IL | 1,466 | 13,107 | 1,469 |
| Argo Chsd 217 | Summit | 1704020 | 21 | 17031 | IL | 1,842 | 40,829 | 2,113 |
| Arlington Heights Sd 25 | Arlington Heights | 1704140 | 13 | 17031 | IL | 5,252 | 50,507 | 6,001 |
| Atwood Heights Sd 125 | Alsip | 1704560 | 21 | 17031 | IL | 734 | 7,674 | 814 |
| Aurora East Usd 131 | Aurora | 1704680 | 21 | 17089 | IL | 14,765 | 88,107 | 19,430 |
| Aurora West Usd 129 | Aurora | 1704710 | 21 | 17089 | IL | 12,626 | 74,470 | 14,837 |
| Avoca Sd 37 | Wilmette | 1704800 | 21 | 17031 | IL | 700 | 6,303 | 733 |
| Bannockburn Sd 106 | Bannockburn | 1704950 | 21 | 17097 | IL | 176 | 2,225 | 201 |
| Barrington Cusd 220 | Barrington | 1705050 | 21 | 17097 | IL | 9,017 | 44,382 | 9,595 |
| Batavia Usd 101 | Batavia | 1705220 | 21 | 17089 | IL | 6,273 | 32,371 | 7,218 |
| Beach Park Ccsd 3 | Beach Park | 1700010 | 21 | 17097 | IL | 2,413 | 20,297 | 2,634 |
| Beecher Cusd 200u | Beecher | 1705430 | 31 | 17197 | IL | 1,076 | 6,695 | 1,277 |
| Bellwood Sd 88 | Bellwood | 1705760 | 21 | 17031 | IL | 2,852 | 22,861 | 2,964 |
| Benjamin Sd 25 | West Chicago | 1705880 | 21 | 17043 | IL | 730 | 7,042 | 884 |
| Bensenville Sd 2 | Bensenville | 1705910 | 21 | 17043 | IL | 2,157 | 19,826 | 2,157 |
| Berkeley Sd 87 | Berkeley | 1706000 | 21 | 17031 | IL | 2,825 | 22,208 | 2,919 |
| Berwyn North Sd 98 | Berwyn | 1706060 | 21 | 17031 | IL | 3,389 | 25,512 | 3,580 |
| Berwyn South Sd 100 | Berwyn | 1706090 | 21 | 17031 | IL | 4,020 | 31,643 | 3,957 |
| Big Hollow Sd 38 | Ingleside | 1706270 | 21 | 17097 | IL | 1,806 | 14,315 | 1,812 |
| Bloom Twp Hsd 206 | Chicago Heights | 1706420 | 21 | 17031 | IL | 3,306 | 65,376 | 4,446 |
| Bloomingdale Sd 13 | Bloomingdale | 1706450 | 21 | 17043 | IL | 1,214 | 13,772 | 1,241 |
| Braceville Sd 75 | Braceville | 1706840 | 31 | 17063 | IL | 174 | 1,416 | 192 |
| Bremen Chsd 228 | Midlothian | 1707050 | 21 | 17031 | IL | 5,432 | 94,556 | 5,910 |
| Brookfield Lagrange Park Sd 95 | Brookfield | 1707320 | 21 | 17031 | IL | 1,099 | 10,983 | 1,160 |
| Brookwood Sd 167 | Glenwood | 1716950 | 21 | 17031 | IL | 1,221 | 10,947 | 1,329 |
| Burbank Sd 111 | Burbank | 1736810 | 21 | 17031 | IL | 3,345 | 30,627 | 3,546 |
| Burnham Sd 154-5 | Burnham | 1707860 | 21 | 17031 | IL | 191 | 1,559 | 214 |
| Butler Sd 53 | Oak Brook | 1707980 | 21 | 17043 | IL | 447 | 5,000 | 430 |
| Calumet City Sd 155 | Calumet City | 1741520 | 21 | 17031 | IL | 1,238 | 11,695 | 1,568 |
| Calumet Public Sd 132 | Calumet Park | 1708130 | 21 | 17031 | IL | 1,199 | 10,846 | 1,332 |
| Cary Ccsd 26 | Cary | 1708730 | 21 | 17111 | IL | 2,655 | 22,766 | 3,320 |
| Cass Sd 63 | Darien | 1708790 | 21 | 17043 | IL | 768 | 8,469 | 864 |
| Ccsd 146 | Tinley Park | 1739030 | 21 | 17031 | IL | 2,358 | 26,681 | 2,582 |
| Ccsd 168 | Sauk Village | 1735460 | 21 | 17031 | IL | 1,561 | 10,473 | 1,722 |
| Ccsd 180 | Burr Ridge | 1730510 | 21 | 17043 | IL | 665 | 6,351 | 826 |
| Ccsd 62 | Des Plaines | 1712120 | 13 | 17031 | IL | 4,800 | 52,067 | 4,964 |
| Ccsd 89 | Glen Ellyn | 1740500 | 21 | 17043 | IL | 1,968 | 22,773 | 2,245 |
| Ccsd 93 | Bloomingdale | 1710470 | 21 | 17043 | IL | 3,834 | 34,959 | 3,914 |
| Center Cass Sd 66 | Downers Grove | 1708970 | 21 | 17043 | IL | 1,041 | 11,330 | 1,163 |
| Central Cusd 301 | Burlington | 1707830 | 41 | 17089 | IL | 3,498 | 18,433 | 3,817 |
| Central Stickney Sd 110 | Chicago | 1737860 | 21 | 17031 | IL | 467 | 2,967 | 398 |
| Chaney-Monge Sd 88 | Crest Hill | 1709510 | 21 | 17197 | IL | 466 | 7,768 | 572 |
| Channahon Sd 17 | Channahon | 1709540 | 21 | 17197 | IL | 1,433 | 10,275 | 1,505 |
| Chicago Heights Sd 170 | Chicago Heights | 1709960 | 21 | 17031 | IL | 3,294 | 24,779 | 3,558 |
| Chicago Ridge Sd 127-5 | Chicago Ridge | 1709990 | 21 | 17031 | IL | 1,453 | 13,429 | 1,362 |
| Chsd 117 | Lake Villa | 1703870 | 21 | 17097 | IL | 2,799 | 45,038 | 2,881 |
| Chsd 128 | Vernon Hills | 1722830 | 21 | 17097 | IL | 3,353 | 49,902 | 3,403 |
| Chsd 155 | Crystal Lake | 1711370 | 21 | 17111 | IL | 6,914 | 96,357 | 7,043 |
| Chsd 218 | Oak Lawn | 1706540 | 21 | 17031 | IL | 5,384 | 122,708 | 6,658 |
| Chsd 94 | West Chicago | 1740440 | 21 | 17043 | IL | 2,130 | 42,651 | 2,538 |
| Chsd 99 | Downers Grove | 1712570 | 21 | 17043 | IL | 5,100 | 111,389 | 5,708 |
| Cicero Sd 99 | Cicero | 1710200 | 21 | 17031 | IL | 13,304 | 85,647 | 13,792 |
| City of Chicago Sd 299 | Chicago | 1709930 | 11 | 17031 | IL | 395,948 | 2,719,275 | 420,432 |
| Coal City Cusd 1 | Coal City | 1710530 | 31 | 17063 | IL | 2,126 | 11,299 | 2,138 |
| Comm Cons Sd 59 | Arlington Heights | 1713770 | 21 | 17031 | IL | 6,756 | 65,973 | 6,486 |
| Cons Hsd 230 | Orland Park | 1708400 | 21 | 17031 | IL | 8,036 | 157,325 | 9,275 |
| Cons Sd 158 | Algonquin | 1719830 | 21 | 17111 | IL | 9,305 | 42,700 | 8,783 |
| Cook County Sd 130 | Blue Island | 1706510 | 21 | 17031 | IL | 3,941 | 30,378 | 3,749 |
| Country Club Hills Sd 160 | Country Club Hills | 1711010 | 21 | 17031 | IL | 1,307 | 12,795 | 1,677 |
| Crete Monee Cusd 201u | Crete | 1711250 | 21 | 17197 | IL | 4,994 | 33,439 | 5,951 |
| Crystal Lake Ccsd 47 | Crystal Lake | 1711350 | 21 | 17111 | IL | 8,092 | 61,984 | 8,669 |
| Cusd 200 | Wheaton | 1742180 | 21 | 17043 | IL | 13,244 | 80,137 | 14,755 |
| Cusd 201 | Westmont | 1741980 | 21 | 17043 | IL | 1,429 | 12,711 | 1,803 |
| Cusd 300 | Carpentersville | 1708550 | 21 | 17089 | IL | 20,775 | 111,550 | 22,273 |
| Darien Sd 61 | Darien | 1721450 | 21 | 17043 | IL | 1,619 | 16,831 | 1,748 |
| Deerfield Sd 109 | Deerfield | 1711980 | 21 | 17097 | IL | 3,085 | 20,696 | 3,196 |
| Dekalb Cusd 428 | Dekalb | 1712000 | 23 | 17037 | IL | 6,230 | 52,524 | 6,518 |
| Diamond Lake Sd 76 | Mundelein | 1712210 | 21 | 17097 | IL | 1,127 | 9,236 | 1,160 |
| Dolton Sd 148 | Riverdale | 1712450 | 21 | 17031 | IL | 2,409 | 22,103 | 3,026 |
| Dolton Sd 149 | Calumet City | 1712420 | 21 | 17031 | IL | 3,095 | 28,526 | 3,597 |
| Downers Grove Gsd 58 | Downers Grove | 1712540 | 21 | 17043 | IL | 5,114 | 52,783 | 5,983 |
| Dupage Hsd 88 | Addison | 1713940 | 21 | 17043 | IL | 4,056 | 83,626 | 4,321 |
| East Maine Sd 63 | Des Plaines | 1713140 | 21 | 17031 | IL | 3,630 | 47,228 | 3,959 |
| East Prairie Sd 73 | Skokie | 1713260 | 13 | 17031 | IL | 571 | 4,658 | 485 |
| Elmhurst Sd 205 | Elmhurst | 1713970 | 21 | 17043 | IL | 8,399 | 47,581 | 9,442 |
| Elmwood Park Cusd 401 | Elmwood Park | 1714100 | 21 | 17031 | IL | 2,985 | 25,102 | 3,638 |
| Elwood Ccsd 203 | Elwood | 1714160 | 41 | 17197 | IL | 401 | 3,794 | 465 |
| Emmons Sd 33 | Antioch | 1714250 | 21 | 17097 | IL | 318 | 3,323 | 352 |
| Esd 159 | Matteson | 1736300 | 21 | 17031 | IL | 1,974 | 19,969 | 2,250 |
| Evanston Ccsd 65 | Evanston | 1714460 | 13 | 17031 | IL | 7,475 | 83,094 | 7,900 |
| Evanston Twp Hsd 202 | Evanston | 1714490 | 13 | 17031 | IL | 3,147 | 83,094 | 3,347 |
| Evergreen Park Chsd 231 | Evergreen Park | 1714580 | 21 | 17031 | IL | 858 | 20,026 | 1,325 |
| Evergreen Park Esd 124 | Evergreen Park | 1714550 | 21 | 17031 | IL | 1,854 | 20,026 | 2,396 |
| Fairmont Sd 89 | Lockport | 1714760 | 21 | 17197 | IL | 319 | 3,712 | 338 |
| Fairview Sd 72 | Skokie | 1714820 | 13 | 17031 | IL | 644 | 6,372 | 648 |
| Fenton Chsd 100 | Bensenville | 1715030 | 21 | 17043 | IL | 1,520 | 30,493 | 1,638 |
| Flossmoor Sd 161 | Chicago Heights | 1715420 | 21 | 17031 | IL | 2,319 | 21,572 | 2,643 |
| Ford Heights Sd 169 | Ford Heights | 1710950 | 21 | 17031 | IL | 473 | 2,844 | 492 |
| Forest Park Sd 91 | Forest Park | 1715450 | 21 | 17031 | IL | 870 | 14,084 | 1,034 |
| Forest Ridge Sd 142 | Oak Forest | 1715480 | 21 | 17031 | IL | 1,623 | 16,330 | 1,752 |
| Fox Lake Gsd 114 | Spring Grove | 1715630 | 21 | 17097 | IL | 819 | 8,919 | 784 |
| Fox River Grove Cons Sd 3 | Fox River Grove | 1715660 | 21 | 17111 | IL | 503 | 4,289 | 542 |
| Frankfort Ccsd 157c | Frankfort | 1715700 | 21 | 17197 | IL | 2,485 | 17,372 | 2,523 |
| Franklin Park Sd 84 | Franklin Park | 1715780 | 21 | 17031 | IL | 1,325 | 11,375 | 1,266 |
| Fremont Sd 79 | Mundelein | 1715930 | 41 | 17097 | IL | 2,213 | 19,208 | 2,553 |
| Gardner Ccsd 72c | Gardner | 1716230 | 42 | 17063 | IL | 222 | 1,829 | 228 |
| Gardner S Wilmington Twp Hsd 73 | Gardner | 1716260 | 42 | 17063 | IL | 198 | 4,140 | 233 |
| Gavin Sd 37 | Ingleside | 1716290 | 21 | 17097 | IL | 922 | 8,233 | 929 |
| Gen George Patton Sd 133 | Riverdale | 1730900 | 21 | 17031 | IL | 404 | 2,362 | 470 |
| Geneva Cusd 304 | Geneva | 1716380 | 21 | 17089 | IL | 5,958 | 29,331 | 6,723 |
| Genoa Kingston Cusd 424 | Genoa | 1716410 | 31 | 17037 | IL | 1,866 | 9,184 | 2,059 |
| Glen Ellyn Sd 41 | Glen Ellyn | 1716800 | 21 | 17043 | IL | 3,667 | 29,312 | 4,268 |
| Glenbard Twp Hsd 87 | Glen Ellyn | 1716830 | 21 | 17043 | IL | ... | 166,782 | 9,547 |
| Glencoe Sd 35 | Glencoe | 1716860 | 21 | 17031 | IL | 1,282 | 8,603 | 1,497 |
| Glenview Ccsd 34 | Glenview | 1716920 | 21 | 17031 | IL | 4,843 | 40,438 | 5,436 |
| Golf Esd 67 | Morton Grove | 1726820 | 21 | 17031 | IL | 575 | 6,797 | 577 |
| Gower Sd 62 | Willowbrook | 1717160 | 21 | 17043 | IL | 871 | 9,787 | 960 |
| Grant Chsd 124 | Fox Lake | 1717340 | 21 | 17097 | IL | 1,894 | 36,946 | 1,864 |
| Grass Lake Sd 36 | Antioch | 1717490 | 41 | 17097 | IL | 180 | 2,630 | 212 |
| Grayslake Ccsd 46 | Grayslake | 1717520 | 21 | 17097 | IL | 4,039 | 30,160 | 4,560 |
| Grayslake Chsd 127 | Grayslake | 1717550 | 21 | 17097 | IL | 2,981 | 44,482 | 2,910 |
| Gurnee Sd 56 | Gurnee | 1717800 | 21 | 17097 | IL | 2,210 | 18,201 | 2,220 |
| Harrison Sd 36 | Wonder Lake | 1718360 | 41 | 17111 | IL | 442 | 4,060 | 462 |
| Harvard Cusd 50 | Harvard | 1718420 | 32 | 17111 | IL | 2,413 | 13,425 | 2,514 |
| Harvey Sd 152 | Harvey | 1718450 | 21 | 17031 | IL | 2,499 | 16,124 | 2,495 |
| Hawthorn Ccsd 73 | Vernon Hills | 1718570 | 21 | 17097 | IL | 3,999 | 29,573 | 3,677 |
| Hazel Crest Sd 152-5 | Hazel Crest | 1718600 | 21 | 17031 | IL | 999 | 8,047 | 1,199 |
| Hiawatha Cusd 426 | Kirkland | 1721300 | 42 | 17037 | IL | 607 | 3,310 | 632 |
| Hillside Sd 93 | Hillside | 1719230 | 21 | 17031 | IL | 511 | 5,763 | 527 |
| Hinckley Big Rock Cusd 429 | Hinckley | 1719260 | 42 | 17037 | IL | 714 | 4,880 | 841 |
| Hinsdale Ccsd 181 | Burr Ridge | 1719290 | 21 | 17043 | IL | 3,951 | 25,846 | 4,571 |
| Hinsdale Twp Hsd 86 | Hinsdale | 1719320 | 21 | 17043 | IL | 4,536 | 75,352 | 5,059 |
| Homer Ccsd 33c | Homer Glen | 1719500 | 21 | 17197 | IL | 3,702 | 29,805 | 3,891 |
| Homewood Flossmoor Chsd 233 | Flossmoor | 1719560 | 21 | 17031 | IL | 2,795 | 38,589 | 2,953 |
| Homewood Sd 153 | Homewood | 1719530 | 21 | 17031 | IL | 1,910 | 16,582 | 1,919 |
| Hoover-Schrum Memorial Sd 157 | Calumet City | 1719680 | 21 | 17031 | IL | 933 | 7,966 | 1,011 |
| Indian Creek Cusd 425 | Shabbona | 1735970 | 42 | 17037 | IL | 765 | 4,654 | 882 |
| Indian Prairie Cusd 204 | Aurora | 1741690 | 12 | 17043 | IL | 28,996 | 129,021 | 29,429 |
| Indian Springs Sd 109 | Justice | 1707170 | 21 | 17031 | IL | 2,851 | 24,678 | 2,905 |
| Itasca Sd 10 | Itasca | 1720220 | 21 | 17043 | IL | 933 | 8,907 | 1,019 |
| J S Morton Hsd 201 | Cicero | 1726880 | 21 | 17031 | IL | 8,362 | 160,467 | 9,821 |
| Johnsburg Cusd 12 | Johnsburg | 1720490 | 21 | 17111 | IL | 2,247 | 12,387 | 2,349 |
| Joliet Psd 86 | Joliet | 1720580 | 21 | 17197 | IL | 11,619 | 84,934 | 11,132 |
| Joliet Twp Hsd 204 | Joliet | 1720610 | 21 | 17197 | IL | 6,109 | 129,595 | 6,821 |
| Kaneland Cusd 302 | Maple Park | 1724480 | 41 | 17089 | IL | 4,799 | 25,919 | 5,335 |
| Keeneyville Sd 20 | Hanover Park | 1720880 | 21 | 17043 | IL | 1,605 | 14,605 | 1,809 |
| Kenilworth Sd 38 | Kenilworth | 1720970 | 21 | 17031 | IL | 559 | 2,828 | 518 |
| Kildeer Countryside Ccsd 96 | Buffalo Grove | 1721030 | 21 | 17097 | IL | 3,054 | 23,637 | 3,292 |
| Kirby Sd 140 | Tinley Park | 1721270 | 21 | 17031 | IL | 3,748 | 36,269 | 4,029 |
| Komarek Sd 94 | North Riverside | 1721420 | 21 | 17031 | IL | 512 | 4,804 | 502 |
| La Grange Sd 102 | La Grange Park | 1721600 | 21 | 17031 | IL | 3,143 | 26,195 | 3,459 |
| La Grange Sd 105 South | La Grange | 1721630 | 21 | 17031 | IL | 1,430 | 11,852 | 1,440 |
| Lagrange Highlands Sd 106 | La Grange Highlands | 1719110 | 21 | 17031 | IL | 870 | 9,388 | 1,031 |
| Lake Bluff Esd 65 | Lake Bluff | 1721720 | 21 | 17097 | IL | 870 | 8,881 | 1,082 |
| Lake Forest Chsd 115 | Lake Forest | 1721780 | 21 | 17097 | IL | 1,686 | 28,247 | 2,013 |
| Lake Forest Sd 67 | Lake Forest | 1721750 | 21 | 17097 | IL | 1,945 | 19,058 | 2,632 |
| Lake Park Chsd 108 | Roselle | 1721840 | 21 | 17043 | IL | 2,759 | 52,022 | 2,887 |
| Lake Villa Ccsd 41 | Lake Villa | 1721870 | 21 | 17097 | IL | 2,953 | 23,353 | 3,363 |
| Lake Zurich Cusd 95 | Lake Zurich | 1721900 | 21 | 17097 | IL | 5,979 | 31,285 | 6,538 |
| Lansing Sd 158 | Lansing | 1722020 | 21 | 17031 | IL | 2,369 | 23,156 | 2,824 |
| Laraway Ccsd 70c | Joliet | 1722050 | 21 | 17197 | IL | 381 | 2,862 | 375 |
| Lemont Twp Hsd 210 | Lemont | 1722500 | 21 | 17031 | IL | 1,473 | 25,824 | 1,649 |
| Lemont-Bromberek Csd 113a | Lemont | 1707290 | 21 | 17031 | IL | 2,336 | 25,473 | 3,176 |
| Leyden Chsd 212 | Franklin Park | 1722740 | 21 | 17031 | IL | 3,545 | 64,682 | 3,505 |
| Libertyville Sd 70 | Libertyville | 1722800 | 21 | 17097 | IL | 2,486 | 18,924 | 2,697 |
| Lincoln Esd 156 | Calumet City | 1708100 | 21 | 17031 | IL | 1,088 | 6,943 | 1,076 |
| Lincoln Way Chsd 210 | New Lenox | 1723070 | 21 | 17197 | IL | 7,346 | 104,939 | 7,528 |
| Lincolnshire-Prairieview Sd 103 | Lincolnshire | 1723090 | 21 | 17097 | IL | 1,628 | 12,495 | 1,706 |
| Lincolnwood Sd 74 | Lincolnwood | 1723100 | 21 | 17031 | IL | 1,239 | 12,701 | 1,379 |
| Lindop Sd 92 | Broadview | 1713440 | 21 | 17031 | IL | 490 | 4,157 | 505 |
| Lisbon Ccsd 90 | Newark | 1723160 | 42 | 17093 | IL | 119 | 912 | 129 |
| Lisle Cusd 202 | Lisle | 1723200 | 21 | 17043 | IL | 1,615 | 13,869 | 1,914 |
| Lockport Sd 91 | Lockport | 1709210 | 21 | 17197 | IL | 677 | 6,698 | 740 |
| Lockport Twp Hsd 205 | Lockport | 1723350 | 21 | 17197 | IL | 3,679 | 76,459 | 4,213 |
| Lombard Sd 44 | Lombard | 1723460 | 21 | 17043 | IL | 3,173 | 35,550 | 3,541 |
| Lyons Sd 103 | Lyons | 1723850 | 21 | 17031 | IL | 2,515 | 21,835 | 2,536 |
| Lyons Twp Hsd 204 | La Grange | 1723880 | 21 | 17031 | IL | 4,039 | 69,329 | 4,234 |
| Maercker Sd 60 | Westmont | 1724000 | 21 | 17043 | IL | 1,341 | 17,582 | 1,554 |
| Maine Township Hsd 207 | Park Ridge | 1724090 | 21 | 17031 | IL | 6,525 | 146,148 | 7,233 |
| Manhattan Sd 114 | Manhattan | 1724270 | 21 | 17197 | IL | 1,308 | 9,246 | 1,323 |
| Mannheim Sd 83 | Franklin Park | 1724330 | 21 | 17031 | IL | 2,678 | 21,373 | 2,566 |
| Marengo Chsd 154 | Marengo | 1724570 | 31 | 17111 | IL | 772 | 13,869 | 869 |
| Marengo-Union E Cons D 165 | Marengo | 1700077 | 31 | 17111 | IL | 1,121 | 10,481 | 1,269 |
| Marquardt Sd 15 | Glendale Heights | 1724780 | 21 | 17043 | IL | 2,735 | 26,268 | 3,243 |
| Matteson Esd 162 | Richton Park | 1725020 | 21 | 17031 | IL | 3,114 | 25,828 | 3,336 |
| Maywood-Melrose Park-Broadview 89 | Melrose Park | 1725110 | 21 | 17031 | IL | 5,388 | 44,982 | 5,980 |
| Mazon-Verona-Kinsman Esd 2c | Mazon | 1725190 | 42 | 17063 | IL | 342 | 2,571 | 367 |
| Mchenry Ccsd 15 | Mchenry | 1725290 | 21 | 17111 | IL | 4,717 | 42,667 | 5,086 |
| Mchenry Chsd 156 | Mchenry | 1725320 | 21 | 17111 | IL | 2,464 | 45,884 | 2,626 |
| Medinah Sd 11 | Roselle | 1725500 | 21 | 17043 | IL | 683 | 7,494 | 786 |
| Midlothian Sd 143 | Midlothian | 1725920 | 21 | 17031 | IL | 1,954 | 15,118 | 1,948 |
| Millburn Ccsd 24 | Old Mill Creek | 1726100 | 41 | 17097 | IL | 1,461 | 8,615 | 1,667 |
| Minooka Ccsd 201 | Minooka | 1726310 | 21 | 17063 | IL | 4,070 | 23,869 | 3,931 |
| Minooka Chsd 111 | Minooka | 1726340 | 21 | 17063 | IL | 2,584 | 38,379 | 2,627 |
| Mokena Sd 159 | Mokena | 1726370 | 21 | 17197 | IL | 1,733 | 17,251 | 2,193 |
| Morris Chsd 101 | Morris | 1726640 | 31 | 17063 | IL | 979 | 18,392 | 1,037 |
| Morris Sd 54 | Morris | 1726610 | 31 | 17063 | IL | 1,202 | 11,648 | 1,297 |
| Morton Grove Sd 70 | Morton Grove | 1726850 | 21 | 17031 | IL | 893 | 9,226 | 885 |
| Mount Prospect Sd 57 | Mt Prospect | 1727210 | 21 | 17031 | IL | 2,158 | 20,427 | 2,416 |
| Mundelein Cons Hsd 120 | Mundelein | 1727570 | 21 | 17097 | IL | 2,185 | 42,775 | 2,541 |
| Mundelein Esd 75 | Mundelein | 1727540 | 21 | 17097 | IL | 1,716 | 15,155 | 1,840 |
| Naperville Cusd 203 | Naperville | 1727710 | 12 | 17043 | IL | 17,544 | 96,238 | 19,130 |
| Nettle Creek Ccsd 24c | Morris | 1727930 | 42 | 17063 | IL | 90 | 932 | 112 |
| New Lenox Sd 122 | New Lenox | 1728140 | 21 | 17197 | IL | 5,302 | 38,948 | 5,792 |
| New Trier Twp Hsd 203 | Northfield | 1728200 | 21 | 17031 | IL | 4,241 | 60,321 | 4,685 |
| Newark Ccsd 66 | Newark | 1728270 | 42 | 17093 | IL | 220 | 2,631 | 333 |
| Newark Chsd 18 | Newark | 1728260 | 42 | 17093 | IL | 182 | 3,668 | 256 |
| Niles Esd 71 | Niles | 1728500 | 21 | 17031 | IL | 504 | 7,817 | 555 |
| Niles Twp Chsd 219 | Skokie | 1728530 | 13 | 17031 | IL | 4,919 | 96,826 | 4,963 |
| Nippersink Sd 2 | Richmond | 1700222 | 21 | 17111 | IL | 1,336 | 11,625 | 1,514 |
| Norridge Sd 80 | Norridge | 1728650 | 21 | 17031 | IL | 1,008 | 12,396 | 1,040 |
| North Chicago Sd 187 | North Chicago | 1700110 | 21 | 17097 | IL | 3,681 | 30,264 | 4,088 |
| North Palos Sd 117 | Palos Hills | 1728890 | 21 | 17031 | IL | 3,115 | 28,462 | 2,927 |
| North Shore Sd 112 | Highland Park | 1700119 | 21 | 17097 | IL | 4,476 | 35,385 | 4,742 |
| Northbrook Esd 27 | Northbrook | 1717850 | 21 | 17031 | IL | 1,227 | 11,094 | 1,251 |
| Northbrook Sd 28 | Northbrook | 1728980 | 21 | 17031 | IL | 1,706 | 14,005 | 1,824 |
| Northbrook/Glenview Sd 30 | Northbrook | 1724420 | 21 | 17031 | IL | 1,124 | 11,053 | 1,231 |
| Northfield Twp Hsd 225 | Glenview | 1729010 | 21 | 17031 | IL | 4,819 | 86,456 | 5,048 |
| Oak Grove Sd 68 | Libertyville | 1729130 | 21 | 17097 | IL | 834 | 6,761 | 1,016 |
| Oak Lawn Chsd 229 | Oak Lawn | 1729220 | 21 | 17031 | IL | 1,921 | 39,950 | 2,171 |
| Oak Lawn-Hometown Sd 123 | Oak Lawn | 1729190 | 21 | 17031 | IL | 3,058 | 35,099 | 3,643 |
| Oak Park - River Forest Sd 200 | Oak Park | 1729280 | 21 | 17031 | IL | 3,285 | 63,603 | 3,510 |
| Oak Park Esd 97 | Oak Park | 1729250 | 21 | 17031 | IL | 5,820 | 52,334 | 6,092 |
| Orland Sd 135 | Orland Park | 1730220 | 21 | 17031 | IL | 5,095 | 55,677 | 6,117 |
| Oswego Cusd 308 | Oswego | 1730270 | 21 | 17093 | IL | 17,595 | 77,718 | 17,994 |
| Palatine Ccsd 15 | Palatine | 1730420 | 21 | 17031 | IL | 12,925 | 120,057 | 13,264 |
| Palos Ccsd 118 | Palos Park | 1730600 | 21 | 17031 | IL | 1,882 | 23,596 | 1,909 |
| Palos Heights Sd 128 | Palos Heights | 1730570 | 21 | 17031 | IL | 763 | 10,365 | 863 |
| Pana Cusd 8 | Pana | 1730630 | 32 | 17093 | IL | 1,402 | 9,461 | 1,613 |
| Park Forest Sd 163 | Park Forest | 1730810 | 21 | 17031 | IL | 1,965 | 15,905 | 1,898 |
| Park Ridge Ccsd 64 | Park Ridge | 1730840 | 21 | 17031 | IL | 4,401 | 40,696 | 4,868 |
| Pennoyer Sd 79 | Norridge | 1731200 | 21 | 17031 | IL | 413 | 5,671 | 420 |
| Peotone Cusd 207u | Peotone | 1731290 | 31 | 17197 | IL | 1,827 | 11,098 | 2,151 |
| Plainfield Sd 202 | Plainfield | 1731740 | 21 | 17197 | IL | 28,726 | 121,290 | 30,099 |
| Plano Cusd 88 | Plano | 1731770 | 21 | 17093 | IL | 2,393 | 11,742 | 2,487 |
| Pleasantdale Sd 107 | Burr Ridge | 1732040 | 21 | 17031 | IL | 807 | 8,216 | 826 |
| Posen-Robbins Esd 143-5 | Posen | 1732370 | 21 | 17031 | IL | ... | 12,607 | 1,863 |
| Prairie Grove Csd 46 | Crystal Lake | 1732520 | 21 | 17111 | IL | 888 | 7,317 | 1,004 |
| Prairie-Hills Esd 144 | Markham | 1724720 | 21 | 17031 | IL | 2,644 | 21,752 | 2,879 |
| Prospect Heights Sd 23 | Prospect Heights | 1732850 | 21 | 17031 | IL | 1,521 | 17,938 | 1,526 |
| Proviso Twp Hsd 209 | Forest Park | 1732910 | 21 | 17031 | IL | 5,063 | 127,726 | 6,980 |
| Queen Bee Sd 16 | Glendale Heights | 1732970 | 21 | 17043 | IL | 1,915 | 17,920 | 2,104 |
| Reavis Twp Hsd 220 | Burbank | 1733270 | 21 | 17031 | IL | 1,803 | 33,592 | 2,049 |
| Reed Custer Cusd 255u | Braidwood | 1733380 | 41 | 17197 | IL | 1,694 | 9,421 | 1,729 |
| Rhodes Sd 84-5 | River Grove | 1733390 | 21 | 17031 | IL | 668 | 4,659 | 621 |
| Rich Twp Hsd 227 | Matteson | 1733420 | 21 | 17031 | IL | 3,656 | 69,985 | 4,639 |
| Richland Gsd 88a | Crest Hill | 1733450 | 21 | 17197 | IL | 965 | 10,108 | 831 |
| Richmond-Burton Chsd 157 | Richmond | 1733510 | 41 | 17111 | IL | ... | 11,625 | 796 |
| Ridgeland Sd 122 | Oak Lawn | 1733690 | 21 | 17031 | IL | 2,338 | 21,909 | 2,381 |
| Ridgewood Chsd 234 | Norridge | 1733720 | 21 | 17031 | IL | 812 | 19,497 | 943 |
| Riley Ccsd 18 | Marengo | 1733750 | 42 | 17111 | IL | 308 | 3,388 | 380 |
| River Forest Sd 90 | River Forest | 1733810 | 21 | 17031 | IL | 1,342 | 11,269 | 1,451 |
| River Grove Sd 85-5 | River Grove | 1733840 | 21 | 17031 | IL | 609 | 8,156 | 690 |
| River Trails Sd 26 | Mt Prospect | 1733870 | 21 | 17031 | IL | 1,374 | 15,335 | 1,590 |
| Riverside Sd 96 | Riverside | 1733990 | 21 | 17031 | IL | 1,618 | 13,967 | 1,695 |
| Riverside-Brookfield Twp Sd 208 | Riverside | 1734020 | 21 | 17031 | IL | 1,447 | 29,451 | 1,569 |
| Rockdale Sd 84 | Rockdale | 1734470 | 21 | 17197 | IL | 283 | 2,199 | 279 |
| Rondout Sd 72 | Lake Forest | 1734620 | 21 | 17097 | IL | 158 | 1,739 | 220 |
| Roselle Sd 12 | Roselle | 1734710 | 21 | 17043 | IL | 734 | 7,244 | 824 |
| Rosemont Esd 78 | Rosemont | 1734770 | 21 | 17031 | IL | 279 | 2,381 | 252 |
| Round Lake Cusd 116 | Round Lake | 1734990 | 21 | 17097 | IL | 7,274 | 36,256 | 7,633 |
| Salt Creek Sd 48 | Villa Park | 1735220 | 21 | 17043 | IL | 471 | 8,357 | 566 |
| Sandridge Sd 172 | Lynwood | 1735340 | 21 | 17031 | IL | 411 | 3,682 | 441 |
| Sandwich Cusd 430 | Sandwich | 1735370 | 21 | 17037 | IL | 2,274 | 13,406 | 2,498 |
| Saratoga Ccsd 60c | Morris | 1735400 | 41 | 17063 | IL | 800 | 5,999 | 785 |
| Schaumburg Ccsd 54 | Schaumburg | 1734740 | 13 | 17031 | IL | 14,085 | 135,022 | 14,203 |
| Schiller Park Sd 81 | Schiller Park | 1735640 | 21 | 17031 | IL | 1,355 | 13,383 | 1,247 |
| Sd 45 Dupage County | Villa Park | 1740350 | 21 | 17043 | IL | 3,346 | 37,341 | 4,034 |
| Sd U-46 | Elgin | 1713710 | 21 | 17089 | IL | 40,340 | 234,231 | 43,861 |
| Skokie Sd 68 | Skokie | 1736450 | 13 | 17031 | IL | 1,773 | 21,323 | 2,007 |
| Skokie Sd 69 | Skokie | 1736480 | 13 | 17031 | IL | 1,707 | 17,995 | 1,789 |
| Skokie Sd 73-5 | Skokie | 1710380 | 13 | 17031 | IL | 1,054 | 9,938 | 1,103 |
| Somonauk Cusd 432 | Somonauk | 1736570 | 31 | 17037 | IL | 864 | 5,013 | 970 |
| South Holland Sd 150 | South Holland | 1736720 | 21 | 17031 | IL | 945 | 10,719 | 1,243 |
| South Holland Sd 151 | South Holland | 1736750 | 21 | 17031 | IL | 1,506 | 13,355 | 1,791 |
| South Wilmington Ccsd 74 | South Wilmington | 1736840 | 42 | 17063 | IL | 100 | 891 | 79 |
| St Charles Cusd 303 | St Charles | 1737170 | 21 | 17089 | IL | 13,464 | 68,949 | 15,492 |
| Steger Sd 194 | Steger | 1737680 | 21 | 17197 | IL | 1,512 | 14,238 | 1,659 |
| Summit Hill Sd 161 | Frankfort | 1738220 | 21 | 17197 | IL | 3,414 | 23,652 | 3,573 |
| Summit Sd 104 | Summit | 1704050 | 21 | 17031 | IL | 1,837 | 12,410 | 1,706 |
| Sunnybrook Sd 171 | Lansing | 1738370 | 21 | 17031 | IL | 1,020 | 11,117 | 1,328 |
| Sunset Ridge Sd 29 | Northfield | 1738400 | 21 | 17031 | IL | 505 | 4,203 | 509 |
| Sycamore Cusd 427 | Sycamore | 1738460 | 23 | 17037 | IL | 3,771 | 21,584 | 4,128 |
| Taft Sd 90 | Lockport | 1738520 | 21 | 17197 | IL | 352 | 3,483 | 471 |
| Thornton Fractional Twp Hsd 215 | Calumet City | 1738940 | 21 | 17031 | IL | 3,480 | 60,985 | 4,248 |
| Thornton Sd 154 | Thornton | 1738910 | 21 | 17031 | IL | 226 | 2,846 | 300 |
| Thornton Twp Hsd 205 | South Holland | 1738970 | 21 | 17031 | IL | 5,064 | 116,331 | 8,285 |
| Township Hsd 211 | Palatine | 1730450 | 13 | 17031 | IL | 12,362 | 238,262 | 12,690 |
| Township Hsd 214 | Arlington Heights | 1704170 | 21 | 17031 | IL | 12,129 | 253,495 | 12,603 |
| Troy Ccsd 30c | Plainfield | 1739510 | 21 | 17197 | IL | 4,544 | 37,072 | 4,928 |
| Twp Hsd 113 | Highland Park | 1719080 | 21 | 17097 | IL | 3,766 | 58,297 | 3,786 |
| Union Ridge Sd 86 | Harwood Heights | 1739780 | 21 | 17031 | IL | 598 | 6,407 | 491 |
| Union Sd 81 | Joliet | 1739660 | 41 | 17197 | IL | 114 | 1,492 | 141 |
| Valley View Cusd 365u | Romeoville | 1740070 | 21 | 17197 | IL | 17,819 | 93,235 | 18,954 |
| W Harvey-Dixmoor Psd 147 | Harvey | 1718480 | 21 | 17031 | IL | 1,394 | 11,688 | 1,622 |
| Warren Twp Hsd 121 | Gurnee | 1740800 | 21 | 17097 | IL | 4,373 | 68,548 | 4,647 |
| Wauconda Cusd 118 | Wauconda | 1741190 | 21 | 17097 | IL | 4,538 | 27,215 | 4,808 |
| Waukegan Cusd 60 | Waukegan | 1741250 | 21 | 17097 | IL | 16,812 | 83,967 | 17,017 |
| West Chicago Esd 33 | West Chicago | 1741550 | 21 | 17043 | IL | 4,499 | 31,442 | 4,223 |
| West Northfield Sd 31 | Northbrook | 1741700 | 21 | 17031 | IL | 855 | 9,866 | 970 |
| Westchester Sd 92-5 | Westchester | 1741790 | 21 | 17031 | IL | 1,249 | 15,963 | 1,519 |
| Western Springs Sd 101 | Western Springs | 1741820 | 21 | 17031 | IL | 1,501 | 10,264 | 1,843 |
| Wheeling Ccsd 21 | Wheeling | 1742210 | 21 | 17031 | IL | 6,968 | 67,677 | 6,784 |
| Will County Sd 92 | Lockport | 1723730 | 21 | 17197 | IL | 1,707 | 14,809 | 2,048 |
| Willow Springs Sd 108 | Willow Springs | 1742570 | 21 | 17031 | IL | 325 | 4,017 | 369 |
| Wilmette Sd 39 | Wilmette | 1742600 | 21 | 17031 | IL | 3,732 | 26,348 | 4,193 |
| Wilmington Cusd 209u | Wilmington | 1742630 | 31 | 17197 | IL | 1,485 | 9,476 | 1,504 |
| Winfield Sd 34 | Winfield | 1742720 | 21 | 17043 | IL | 350 | 4,167 | 417 |
| Winnetka Sd 36 | Winnetka | 1742840 | 21 | 17031 | IL | 1,830 | 12,037 | 2,225 |
| Winthrop Harbor Sd 1 | Winthrop Harbor | 1742900 | 21 | 17097 | IL | 590 | 6,627 | 687 |
| Wood Dale Sd 7 | Wood Dale | 1743020 | 21 | 17043 | IL | 1,227 | 10,667 | 1,187 |
| Woodland Ccsd 50 | Gurnee | 1743110 | 21 | 17097 | IL | 6,508 | 51,292 | 7,280 |
| Woodridge Sd 68 | Woodridge | 1717040 | 21 | 17043 | IL | 3,035 | 33,112 | 3,202 |
| Woodstock Cusd 200 | Woodstock | 1743330 | 31 | 17111 | IL | 6,512 | 37,214 | 6,489 |
| Worth Sd 127 | Worth | 1743380 | 21 | 17031 | IL | 1,084 | 11,309 | 1,095 |
| Yorkville Cusd 115 | Yorkville | 1743960 | 21 | 17093 | IL | 5,630 | 29,550 | 6,373 |
| Zion Esd 6 | Zion | 1743860 | 21 | 17097 | IL | 2,755 | 17,464 | 2,598 |
| Zion-Benton Twp Hsd 126 | Zion | 1743890 | 21 | 17097 | IL | 2,769 | 44,384 | 2,952 |
| Crown Point Community Sch Corp | Crown Point | 1802490 | 21 | 18089 | IN | 7,757 | 41,424 | 7,665 |
| Duneland School Corporation | Chesterton | 1802800 | 21 | 18127 | IN | 5,957 | 35,088 | 6,538 |
| East Porter County School Corp | Kouts | 1809000 | 41 | 18127 | IN | 2,452 | 13,080 | 2,381 |
| Gary Community School Corp | Gary | 1803870 | 13 | 18089 | IN | 8,873 | 74,605 | 14,738 |
| Griffith Public Schools | Griffith | 1804170 | 21 | 18089 | IN | 2,492 | 16,640 | 2,890 |
| Hanover Community School Corp | Cedar Lake | 1804350 | 21 | 18089 | IN | 2,138 | 12,328 | 2,266 |
| Kankakee Valley School Corp | Wheatfield | 1805280 | 42 | 18073 | IN | 3,488 | 20,109 | 3,940 |
| Lake Central School Corp | Saint John | 1805450 | 21 | 18089 | IN | 10,009 | 66,125 | 11,472 |
| Lake Ridge Schools | Gary | 1805460 | 21 | 18089 | IN | 1,905 | 12,070 | 2,135 |
| Lake Station Community Schools | Lake Station | 1802910 | 21 | 18089 | IN | 1,520 | 8,497 | 1,505 |
| M S D Boone Township | Hebron | 1800750 | 41 | 18127 | IN | 1,155 | 6,239 | 1,108 |
| Merrillville Community School | Merrillville | 1809690 | 21 | 18089 | IN | 6,858 | 46,960 | 7,873 |
| North Newton School Corp | Morocco | 1807920 | 42 | 18111 | IN | 1,478 | 9,133 | 1,571 |
| Portage Township Schools | Portage | 1809150 | 21 | 18127 | IN | 8,096 | 47,715 | 8,752 |
| Porter Township School Corp | Valparaiso | 1809180 | 41 | 18127 | IN | 1,519 | 9,497 | 1,616 |
| Rensselaer Central School Corp | Rensselaer | 1809420 | 32 | 18073 | IN | 1,739 | 10,694 | 1,889 |
| River Forest Community Sch Corp | Hobart | 1804620 | 21 | 18089 | IN | 1,530 | 7,344 | 1,339 |
| School City of East Chicago | East Chicago | 1802880 | 21 | 18089 | IN | 5,258 | 29,424 | 6,212 |
| School City of Hammond | Hammond | 1804320 | 21 | 18089 | IN | 13,670 | 80,437 | 15,501 |
| School City of Hobart | Hobart | 1804590 | 21 | 18089 | IN | 3,969 | 23,759 | 4,023 |
| School Town of Highland | Highland | 1804560 | 21 | 18089 | IN | 3,242 | 23,508 | 3,603 |
| School Town of Munster | Munster | 1807350 | 21 | 18089 | IN | 4,158 | 23,341 | 4,329 |
| South Newton School Corp | Kentland | 1810470 | 43 | 18111 | IN | 873 | 5,133 | 878 |
| Tri-Creek School Corporation | Lowell | 1811460 | 41 | 18089 | IN | 3,556 | 20,401 | 3,838 |
| Union Township School Corp | Valparaiso | 1811700 | 41 | 18127 | IN | 1,559 | 8,929 | 1,700 |
| Valparaiso Community Schools | Valparaiso | 1811970 | 21 | 18127 | IN | 6,423 | 43,855 | 6,987 |
| Whiting School City | Whiting | 1813200 | 21 | 18089 | IN | 1,123 | 4,593 | 869 |
| Brighton #1 School District | Kansasville | 5501650 | 41 | 55059 | WI | 208 | 1,358 | 151 |
| Bristol #1 School District | Bristol | 5501710 | 21 | 55059 | WI | 715 | 5,000 | 628 |
| Central/Westosha Uhs School District | Salem | 5513290 | 21 | 55059 | WI | 1,133 | 19,839 | 1,275 |
| Kenosha School District | Kenosha | 5507320 | 22 | 55059 | WI | 22,570 | 128,954 | 23,657 |
| Paris J1 School District | Kenosha | 5511400 | 41 | 55059 | WI | 273 | 1,732 | 190 |
| Randall J1 School District | Burlington | 5512390 | 21 | 55059 | WI | 677 | 5,341 | 651 |
| Salem School District | Salem | 5513350 | 21 | 55059 | WI | 1,027 | 9,344 | 1,157 |
| Silver Lake J1 School District | Silver Lake | 5513860 | 21 | 55059 | WI | 551 | 4,078 | 492 |
| Trevor-Wilmot Consolidated School District | Trevor | 5500052 | 41 | 55059 | WI | 565 | 4,027 | 560 |
| Twin Lakes #4 School District | Twin Lakes | 5515090 | 21 | 55059 | WI | 415 | 3,680 | 426 |
| Wheatland J1 School District | Burlington | 5516560 | 41 | 55059 | WI | 402 | 4,199 | 496 |
| Wilmot Uhs School District | Wilmot | 5516770 | 41 | 55059 | WI | 1,101 | 18,872 | 1,173 |
Number of districts: 353 ... Total enrollment: 1,552,506
All school districts interactive tables General Demographics | Social | Economic | Housing
All school districts enrollment & adminstratively reported data interactive table.
7.2. Component Higher Education Institution Characteristics go top
2014-15 School Year. Extended detail Available in subscription edition.
| Institution | City Name | Code | Level | Total UG Enrollment | Fulltime UG Enrollment | Total Grad Enrollment | Fulltime Grad Enrollment |
| Ambria College of Nursing | Hoffman Estates, IL | 457527 | 3 | 432 | 299 | 0 | 0 |
| American Academy of Art | Chicago, IL | 142887 | 5 | 365 | 246 | 0 | 0 |
| American InterContinental University-Online | Schaumburg, IL | 445027 | 7 | 10,544 | 5,556 | 1,356 | 496 |
| Argosy University-Chicago | Chicago, IL | 145770 | 9 | 247 | 83 | 611 | 161 |
| Argosy University-Schaumburg | Schaumburg, IL | 420866 | 9 | 90 | 40 | 259 | 70 |
| Aurora University | Aurora, IL | 143118 | 9 | 3,204 | 2,832 | 1,880 | 681 |
| Benedictine University | Lisle, IL | 145619 | 9 | 3,818 | 3,072 | 2,489 | 430 |
| Brown Mackie College-Merrillville | Merrillville, IN | 151616 | 5 | 512 | 512 | 0 | 0 |
| Calumet College of Saint Joseph | Whiting, IN | 150172 | 7 | 907 | 532 | 165 | 56 |
| Carthage College | Kenosha, WI | 238476 | 7 | 2,856 | 2,599 | 92 | 16 |
| Chamberlain College of Nursing-Illinois | Addison, IL | 454227 | 9 | 13,279 | 2,850 | 5,386 | 286 |
| Chicago ORT Technical Institute | Skokie, IL | 393180 | 3 | 433 | 433 | 0 | 0 |
| Chicago State University | Chicago, IL | 144005 | 9 | 3,912 | 2,498 | 1,299 | 736 |
| Christian Life College | Mount Prospect, IL | 260947 | 5 | 38 | 18 | 0 | 0 |
| City Colleges of Chicago-Harold Washington College | Chicago, IL | 144209 | 3 | 9,392 | 5,828 | 0 | 0 |
| City Colleges of Chicago-Harry S Truman College | Chicago, IL | 144184 | 3 | 10,601 | 2,623 | 0 | 0 |
| City Colleges of Chicago-Kennedy-King College | Chicago, IL | 144157 | 3 | 5,313 | 2,632 | 0 | 0 |
| City Colleges of Chicago-Malcolm X College | Chicago, IL | 144166 | 3 | 6,245 | 2,738 | 0 | 0 |
| City Colleges of Chicago-Olive-Harvey College | Chicago, IL | 144175 | 3 | 4,572 | 1,959 | 0 | 0 |
| City Colleges of Chicago-Richard J Daley College | Chicago, IL | 144193 | 3 | 8,914 | 3,055 | 0 | 0 |
| City Colleges of Chicago-Wilbur Wright College | Chicago, IL | 144218 | 3 | 12,146 | 4,063 | 0 | 0 |
| College of Court Reporting Inc | Hobart, IN | 150251 | 3 | 218 | 52 | 0 | 0 |
| College of DuPage | Glen Ellyn, IL | 144865 | 3 | 29,476 | 10,022 | 0 | 0 |
| College of Lake County | Grayslake, IL | 146472 | 3 | 15,410 | 4,303 | 0 | 0 |
| Columbia College-Chicago | Chicago, IL | 144281 | 7 | 9,003 | 8,172 | 437 | 319 |
| Concordia University-Chicago | River Forest, IL | 144351 | 9 | 1,538 | 1,397 | 3,500 | 214 |
| Coyne College | Chicago, IL | 144485 | 3 | 611 | 611 | 0 | 0 |
| DePaul University | Chicago, IL | 144740 | 9 | 16,153 | 13,643 | 7,646 | 4,858 |
| DeVry University-Illinois | Chicago, IL | 482477 | 7 | 18,264 | 5,870 | 5,956 | 1,035 |
| Dominican University | River Forest, IL | 148496 | 9 | 2,180 | 1,996 | 1,318 | 360 |
| East-West University | Chicago, IL | 144883 | 5 | 555 | 551 | 0 | 0 |
| Elgin Community College | Elgin, IL | 144944 | 3 | 10,929 | 3,564 | 0 | 0 |
| Elmhurst College | Elmhurst, IL | 144962 | 7 | 2,853 | 2,699 | 404 | 85 |
| Fox College | Bedford Park, IL | 145239 | 3 | 360 | 360 | 0 | 0 |
| Gateway Technical College | Kenosha, WI | 238759 | 3 | 7,410 | 1,421 | 0 | 0 |
| Governors State University | University Park, IL | 145336 | 9 | 3,585 | 1,713 | 2,191 | 751 |
| Hair Professionals Academy of Cosmetology | West Dundee, IL | 145406 | 4 | 239 | 83 | 0 | 0 |
| Harper College | Palatine, IL | 149842 | 3 | 14,957 | 5,391 | 0 | 0 |
| Harrington College of Design | Chicago, IL | 145460 | 7 | 298 | 129 | 218 | 44 |
| Hebrew Theological College | Skokie, IL | 145497 | 7 | 465 | 377 | 3 | 3 |
| Herzing University-Kenosha | Kenosha, WI | 459842 | 7 | 452 | 237 | 11 | 7 |
| ITT Technical Institute-Arlington Heights | Arlington Heights, IL | 260974 | 5 | 233 | 168 | 0 | 0 |
| ITT Technical Institute-Merrillville | Merrillville, IN | 459587 | 5 | 380 | 272 | 0 | 0 |
| ITT Technical Institute-Oak Brook | Oak Brook, IL | 434557 | 5 | 307 | 243 | 0 | 0 |
| ITT Technical Institute-Orland Park | Orland Park, IL | 414586 | 5 | 524 | 294 | 0 | 0 |
| Illinois Institute of Technology | Chicago, IL | 145725 | 9 | 3,099 | 2,922 | 4,799 | 3,759 |
| Indiana University-Northwest | Gary, IN | 151360 | 7 | 5,661 | 3,114 | 391 | 109 |
| International Academy of Design and Technology-Chicago | Chicago, IL | 146010 | 5 | 229 | 190 | 0 | 0 |
| Joliet Junior College | Joliet, IL | 146296 | 3 | 15,776 | 5,562 | 0 | 0 |
| Judson University | Elgin, IL | 146339 | 9 | 1,154 | 781 | 134 | 83 |
| Kendall College | Chicago, IL | 146393 | 5 | 1,516 | 904 | 0 | 0 |
| Kishwaukee College | Malta, IL | 146418 | 3 | 4,475 | 2,030 | 0 | 0 |
| Lake Forest College | Lake Forest, IL | 146481 | 7 | 1,607 | 1,589 | 19 | 3 |
| Le Cordon Bleu College of Culinary Arts-Chicago | Chicago, IL | 144467 | 3 | 1,086 | 1,086 | 0 | 0 |
| Lewis University | Romeoville, IL | 146612 | 9 | 4,752 | 3,816 | 1,937 | 387 |
| Lincoln College of Technology-Melrose Park | Melrose Park, IL | 146700 | 3 | 717 | 717 | 0 | 0 |
| Loyola University Chicago | Chicago, IL | 146719 | 9 | 10,322 | 9,331 | 5,580 | 4,100 |
| MacCormac College | Chicago, IL | 146816 | 3 | 216 | 95 | 0 | 0 |
| McHenry County College | Crystal Lake, IL | 147004 | 3 | 6,567 | 2,460 | 0 | 0 |
| Midwest College of Oriental Medicine-Chicago | Chicago, IL | 439020 | 9 | 49 | 23 | 77 | 44 |
| Midwestern Career College | Chicago, IL | 457536 | 4 | 85 | 85 | 0 | 0 |
| Moody Bible Institute | Chicago, IL | 147369 | 7 | 3,235 | 2,498 | 732 | 210 |
| Moraine Valley Community College | Palos Hills, IL | 147378 | 3 | 15,286 | 6,624 | 0 | 0 |
| Morton College | Cicero, IL | 147411 | 3 | 4,653 | 1,439 | 0 | 0 |
| National Louis University | Chicago, IL | 147536 | 9 | 1,341 | 689 | 3,241 | 1,349 |
| National University of Health Sciences | Lombard, IL | 147590 | 9 | 97 | 37 | 608 | 588 |
| North Central College | Naperville, IL | 147660 | 7 | 2,782 | 2,601 | 261 | 80 |
| North Park University | Chicago, IL | 147679 | 9 | 2,200 | 1,911 | 985 | 129 |
| Northeastern Illinois University | Chicago, IL | 147776 | 7 | 8,412 | 4,695 | 1,863 | 374 |
| Northern Illinois University | Dekalb, IL | 147703 | 9 | 15,435 | 13,489 | 5,176 | 2,368 |
| Northwestern College-Chicago Campus | Chicago, IL | 147749 | 3 | 338 | 170 | 0 | 0 |
| Northwestern College-Southwestern Campus | Bridgeview, IL | 260992 | 3 | 743 | 256 | 0 | 0 |
| Northwestern University | Evanston, IL | 147767 | 9 | 9,048 | 8,398 | 12,506 | 8,624 |
| Oakton Community College | Des Plaines, IL | 147800 | 3 | 10,589 | 2,947 | 0 | 0 |
| Pacific College of Oriental Medicine-Chicago | Chicago, IL | 442842 | 7 | 71 | 22 | 125 | 93 |
| Prairie State College | Chicago Heights, IL | 148007 | 3 | 4,574 | 1,774 | 0 | 0 |
| Prince Institute-Great Lakes | Schaumburg, IL | 475529 | 4 | 51 | 49 | 0 | 0 |
| Purdue University-Calumet Campus | Hammond, IN | 152248 | 8 | 8,491 | 4,905 | 1,010 | 353 |
| Resurrection University | Chicago, IL | 149763 | 8 | 406 | 238 | 102 | 52 |
| Robert Morris University Illinois | Chicago, IL | 148335 | 7 | 2,779 | 2,666 | 426 | 42 |
| Roosevelt University | Chicago, IL | 148487 | 9 | 3,793 | 2,953 | 2,276 | 1,119 |
| Rush University | Chicago, IL | 148511 | 9 | 143 | 95 | 2,314 | 1,425 |
| SAE Institute of Technology-Chicago | Chicago, IL | 485139 | 3 | 118 | 118 | 0 | 0 |
| SOLEX College | Wheeling, IL | 459356 | 3 | 91 | 72 | 0 | 0 |
| Saint Augustine College | Chicago, IL | 148876 | 5 | 1,529 | 1,118 | 0 | 0 |
| Saint Josephs College | Rensselaer, IN | 152363 | 7 | 1,142 | 1,012 | 24 | 8 |
| Saint Xavier University | Chicago, IL | 148627 | 8 | 2,974 | 2,557 | 1,099 | 182 |
| School of the Art Institute of Chicago | Chicago, IL | 143048 | 7 | 2,861 | 2,602 | 738 | 648 |
| Shimer College | Chicago, IL | 148849 | 5 | 74 | 67 | 0 | 0 |
| South Suburban College | South Holland, IL | 149365 | 3 | 4,329 | 1,725 | 0 | 0 |
| Taylor Business Institute | Chicago, IL | 149310 | 4 | 280 | 280 | 0 | 0 |
| Telshe Yeshiva-Chicago | Chicago, IL | 149329 | 7 | 67 | 67 | 12 | 12 |
| The Illinois Institute of Art-Chicago | Chicago, IL | 148177 | 5 | 1,807 | 1,234 | 0 | 0 |
| The Illinois Institute of Art-Schaumburg | Schaumburg, IL | 428286 | 5 | 902 | 614 | 0 | 0 |
| The Salon Professional Academy-Kenosha | Kenosha, WI | 461908 | 4 | 89 | 61 | 0 | 0 |
| Tribeca Flashpoint Media Arts Academy | Chicago, IL | 460747 | 5 | 353 | 353 | 0 | 0 |
| Trinity Christian College | Palos Heights, IL | 149505 | 8 | 1,337 | 1,114 | 69 | 31 |
| Trinity International University-Illinois | Deerfield, IL | 149514 | 9 | 873 | 709 | 1,329 | 455 |
| Triton College | River Grove, IL | 149532 | 3 | 11,577 | 3,404 | 0 | 0 |
| Universal Technical Institute of Illinois Inc | Lisle, IL | 366191 | 4 | 1,403 | 1,403 | 0 | 0 |
| University of Chicago | Chicago, IL | 144050 | 9 | 5,738 | 5,674 | 9,359 | 6,984 |
| University of Illinois at Chicago | Chicago, IL | 145600 | 9 | 16,718 | 15,459 | 11,251 | 7,804 |
| University of Phoenix-Chicago Campus | Schaumburg, IL | 442161 | 7 | 781 | 781 | 68 | 68 |
| University of St Francis | Joliet, IL | 148584 | 9 | 1,762 | 1,357 | 2,000 | 189 |
| University of Wisconsin-Parkside | Kenosha, WI | 240374 | 7 | 4,407 | 3,336 | 136 | 30 |
| Valparaiso University | Valparaiso, IN | 152600 | 9 | 3,251 | 3,150 | 1,256 | 877 |
| VanderCook College of Music | Chicago, IL | 149639 | 7 | 148 | 105 | 28 | 9 |
| Waubonsee Community College | Sugar Grove, IL | 149727 | 3 | 10,904 | 3,281 | 0 | 0 |
| Westwood College-Chicago Loop | Chicago, IL | 443687 | 5 | 381 | 316 | 0 | 0 |
| Westwood College-Dupage | Woodridge, IL | 406194 | 5 | 157 | 118 | 0 | 0 |
| Westwood College-O'Hare Airport | Chicago, IL | 178226 | 5 | 311 | 244 | 0 | 0 |
| Westwood College-River Oaks | Calumet City, IL | 440147 | 5 | 269 | 210 | 0 | 0 |
| Wheaton College | Wheaton, IL | 149781 | 9 | 2,432 | 2,368 | 482 | 268 |
| Worsham College of Mortuary Science | Wheeling, IL | 369455 | 3 | 108 | 108 | 0 | 0 |
Number of institutions: 114 ... Total undergraduate enrollment: 465,171
Levels: 3-Assoc degree, 4-at least 2, but < 4 years, 5-Bach degree, 6-Postbacc cert, 7 Masters degree, 8 Post-masters cert, 9 Doctors degree
8. GeoPolitics go top
Updated periodically. Voting patterns, citizen voting age population, state legislative districts, congressional districts .. in this metro.
Available in subscription edition.
Notes
• All data are for current vintage county and metro definition.
• Developed by ProximityOne -- Metro Reports (888-364-7656)
• Data sources: ProximityOne, Census Bureau, Bureau of Economic Analysis, Bureau of Labor Statistics, Federal Housing Finance Agency,
National Center for Education Statistics.
Updates go top
The subscription edition updates frequently. Selected items are listed below. Register to receive update notifications.
• Overview lead narrative; quarterly & annual/March.
• Housing Price Index (section 5.4) quarterly.
• Establishments, employment & earnings (section 6.6) quarterly.
• Economic profile and personal income (section 6.1) annual/November.
• Labor market situation (section 6.7) monthly.
• Residential construction; units authorized & value (section 5.3.) monthly.
• Population by county; annual series 2010-2016 (section 4.2.) annual/July.
• Population by county; links for individual counties (section 4.2.) annual/July.
-- includes annual data 2010-2016.
-- includes components of change; race/origin; single year of age; age group summaries.
• Total population and components of change; annual/March.
• Census tracts overview section; annual/December.
• General Demographics section updated/extended; annual/December.
• Gross Domestic Product section; annual/September.
• Higher education institutions; annual/February.
• Metro & county demographic component detailed annual estimates; annual/March.
• School districts in metro & K-12 enrollment; annual/August.
More about schedule and upcoming events ... Calendar ... Upcoming Events ... Find Event
Terms of Use go top
Situation & Outlook Reports are a proprietary resource developed by ProximityOne. There is no warranty of any type associated with any aspect of this report. The user of this document is solely responsible to any use, direct or indirect, that might be made of this document.
Related Resources go top
• Metros main page
• Current estimates and projections: states to 2030, counties & metros to 2020 by age, counties & states to 2060.
• Making Custom Metropolitan Area Maps
• Rental Market Conditions by Metropolitan Area
• Metro Gross Domestic Product
• Housing Price Index
• Establishments, Employment & Earnings
• Regional Economic Information System
• ACS 2014 1-year General Demographics ... Social Characteristics ... Economic Characteristics ... Housing Characteristics
Using this Document go top
The Situation & Outlook Report, a component of the Situation & Outlook, is a core ProximityOne information resource providing insights into characteristics and trends of counties, metropolitan areas, states and the U.S. The Report also provides a gateway to drill-down demographic, economic and business data for smaller geographic areas.
Metropolitan areas include approximately 94 percent of the U.S. population -- 85 percent in metropolitan statistical areas (MSAs) and 9 percent in micropolitan statistical areas (MISAs).
About Metropolitan Areas & Principal Cities -- scroll section go top
Metropolitan Areas are designated by OMB ("Standards for Delineating Metropolitan and Micropolitan Statistical Areas") based
mainly on Census Bureau-sourced data.
Metropolitan areas are defined as Metropolitan Statistical Areas (MSA) and Micropolitan Statistical Areas (MISA).
MSAs and MISAs are also referred to a Core-Based Statistical Areas (CBSAs).
Contiguous CBSAs are defined as Combined Statistical Areas (CSA).
By definition, metropolitan areas are comprised of one or more contiguous counties. Metropolitan areas are not single cities and typically include many cities. Metropolitan areas are comprised of urban and rural areas and often have large expanses of rural territory. A business and demographic-economic synergy exists within each metro; metros often interact with adjacent metros. The demographic-economic make-up of metros vary widely and change often. See more about metros.
Principal Cities. The largest city in each metropolitan or micropolitan statistical area is designated a "principal city." Principal cities are designated by OMB based on Census-sourced data. Additional cities qualify as principal cities if specified requirements are met concerning population size and employment. The title of each metropolitan or micropolitan statistical area consists of the names of up to three of its principal cities and the name of each state into which the metropolitan or micropolitan statistical area extends. Titles of metropolitan divisions also typically are based on principal city names but in certain cases consist of county names.
One or more principal cities are designated within each Metropolitan Statistical Area (MSA) and Micropolitan Statistical Area (MISA). The term "principal city" is defined in the OMB "Standards for Delineating Metropolitan and Micropolitan Statistical Areas." A principal city is an OMB designation applied to one or more incorporated places and/or census designated places (CDPs). The OMB standards designate a Principal City (or Cities) of a Core-Based Statistical Area (CBSA) as determined by:
a) The largest incorporated place with a 2010 Census population of at least 10,000 in the CBSA or,
if no incorporated place of at least 10,000 population is present in the CBSA,
the largest incorporated place or census designated place in the CBSA; and
b) Additional places with 2010 Census population of at least 250,000 or in which 100,000 or more persons work; and
c) Additional places with 2010 Census population of 50,000-250,000,
and number of workers working in the place meets or exceeds the number of workers living in the place; and
d) Additional places with 2010 Census population of 10,000-50,000, and at least one-third the population size of the largest place,
and in which the number of workers working in the place meets or exceeds the number of workers living in the place.
ProximityOne User Group go top
Join the ProximityOne User Group to keep up-to-date with new developments relating to metros and component geography decision-making information resources. Receive updates and access to tools and resources available only to members. Use this form to join the User Group.
Support Using these Resources go top
Learn more about accessing and using demographic-economic data and related analytical tools. Join us in a Data Analytics Lab session. There is no fee for these one-hour Web sessions. Each informal session is focused on a specific topic. The open structure also provides for Q&A and discussion of application issues of interest to participants.
Additional Information go top
ProximityOne develops geographic-demographic-economic data and analytical tools and helps organizations knit together and use diverse data in a decision-making and analytical framework. We develop custom demographic/economic estimates and projections, develop geographic and geocoded address files, and assist with impact and geospatial analyses. Wide-ranging organizations use our tools (software, data, methodologies) to analyze their own data integrated with other data. Follow ProximityOne on Twitter at www.twitter.com/proximityone. Contact us (888-364-7656) with questions about data covered in this section or to discuss custom estimates, projections or analyses for your areas of interest.
Copyright © 2018 ProximityOne