
| Decision-Making Information |
|
ProximityOne information resources & solutions (888) DMI-SOLN (888) 364-7656 Put data to work more effectively. Certificate in Data Analytics Power of Combining Maps with Data Support & Technical Assistance help using these resources Metro in Regional Context 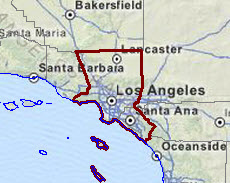 |
Situation & Outlook Report
Los Angeles-Long Beach-Anaheim, CA Metropolitan Statistical Area (CBSA 31080)
Geographic-Demographic-Economic Characteristics -- access other areas
See about updates.
This section is no longer being updated. Access the permanent replacement section at http://proximityone.com/cbsa/1/cbsa31080.htm. Please bookmark this new URL.
Access 2018 S&O Reports, featuring county and metro projections to 2030, via the interactive table at http://proximityone.com/metros.htm. The 2018 reports are similar but have been greatly expanded and updated.
Contents of this Report
This document is organized into these sections:
1. Recent Trends & Outlook
Summary of recent business, demographic, economic trends; year-ahead & 5-year outlook.
- the Recent Trends & Outlook section, updated quarterly, covers topics about this metro such as .. assessing the implications of next jobs report .. impact of Fed''s interest rate action .. which sectors are expanding or contracting .. housing market conditions .. insights to help your planning and decision-making. The Recent Trends & Outlook section is available in the subscription edition.
2. Overview & Update
The total population of the Los Angeles-Long Beach-Anaheim, CA MSA metro changed from 12,843,875 in 2010 to 13,254,397 in 2015, a change of 496,193 (3.9%). Among all 917 metros, this metro was ranked number 2 in 2010 and 2 in 2015, based on total population. Annual net migration was 18,246 (2011), 17,255 (2012), 17,216 (2013), 9,709 (2014), 9,709 (2015). View annual population estimates and components of change table. See more about population characteristics below.
This metro is projected to have a total population in 2020 of 14,151,120. The projected population change from 2010 to 2020 is 1,305,809 (10.2%). The population ages 65 years and over is projected to change from 1,461,263 (2010) to 2,231,510 (2020), a change of 770,247 (52.7%). See more about population projections.
Based on per capita personal income (PCPI), this metro was ranked number 59 in 2008 and 56 in 2014. among the 917 metros for which personal income was estimated.The PCPI changed from $45,194 in 2008 to $50,751 in 2014, a change of $5,557 (12.3%). Per capita personal income (PCPI) is a comprehensive measure of individual economic well-being. Use the interactive table to compare PCPI in this metro to other metros. See more about PCPI in Economic Characteristics section below.
282 metropolitan statistical areas, of the total 381, experienced an increase in real Gross Domestic Product (GDP) between 2009 and 2014. This metro ranked number 2 among the 381 metros based on 2014 GDP. The GDP (millions of current dollars) changed from $753,732 in 2009 to $866,745 in 2014 a change of $113,013 (14.99%). Real GDP (millions of real, inflation adjusted, dollars) changed from $753,732 in 2009 to $797,697 in 2014, a change of $43,965 (5.83%). GDP is the most comprehensive measure of metro economic activity. GDP is the sum of the GDP originating in all industries in the metro. See more about GDP in Economic Characteristics section below.
Attributes of driil-down, small area geography within the metro ... metros account for 65,744 of the national scope 73,056 census tracts (others are in non-metro areas). This metro is comprised of 2,929 tracts covering the metro wall-to-wall. View, rank, compare demographic-economic attributes of these tracts using the interactive tables. Use the CBSA code 31080; see table usage details below the table.
Fortune 1000 Companies with headquarters in this metro.
• AECOM Technology Corporation
• Activision Blizzard, Inc.
• Allergan, Inc.
• Apria Healthcare Group Inc.
• Avery Dennison Corporation
• Broadcom Corporation
• CBRE Group, Inc.
• DIRECTV
• Edison International
• Edwards Lifesciences Corporation
• First American Financial Corporation
• Guess?, Inc.
• HCP, Inc.
• Health Net, Inc.
• Ingram Micro Inc.
• Jacobs Engineering Group Inc.
• KB Home
• Live Nation Entertainment, Inc.
• Mattel, Inc.
• Mercury General Corporation
• Molina Healthcare, Inc.
• Oaktree Capital Group, LLC
• Occidental Petroleum Corporation
• Public Storage
• Reliance Steel & Aluminum Co.
• Spectrum Group International, Inc.
• Standard Pacific Corp.
• Tetra Tech, Inc.
• The Walt Disney Company
• Tutor Perini Corporation
• Unified Grocers, Inc.
• Western Digital Corporation
Number in this metro: 32. Extended data & analysis in subscription edition.• Activision Blizzard, Inc.
• Allergan, Inc.
• Apria Healthcare Group Inc.
• Avery Dennison Corporation
• Broadcom Corporation
• CBRE Group, Inc.
• DIRECTV
• Edison International
• Edwards Lifesciences Corporation
• First American Financial Corporation
• Guess?, Inc.
• HCP, Inc.
• Health Net, Inc.
• Ingram Micro Inc.
• Jacobs Engineering Group Inc.
• KB Home
• Live Nation Entertainment, Inc.
• Mattel, Inc.
• Mercury General Corporation
• Molina Healthcare, Inc.
• Oaktree Capital Group, LLC
• Occidental Petroleum Corporation
• Public Storage
• Reliance Steel & Aluminum Co.
• Spectrum Group International, Inc.
• Standard Pacific Corp.
• Tetra Tech, Inc.
• The Walt Disney Company
• Tutor Perini Corporation
• Unified Grocers, Inc.
• Western Digital Corporation
3. Lay of the Land & Neighborhood Patterns of Economic Prosperity go top
3.1. Lay of the Land go top
Lay of the Land. The following map shows the metro with bold boundary.
Counties are labeled with county name and state-county FIPS code.
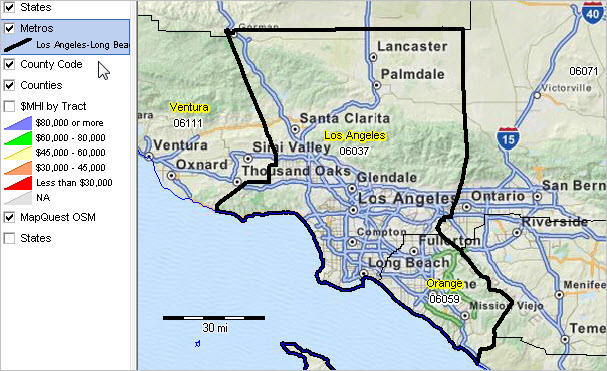
View developed with CV XE GIS software. See this section to learn about making custom metro maps.
3.2. Patterns of Economic Prosperity by Neighborhood go top
Median household income by census tract (see color/data legend at left of map).
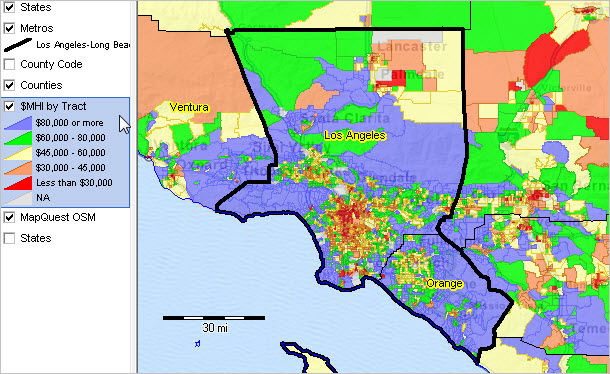
View developed with CV XE GIS software. See this section to learn about making custom metro maps.
4. Population Characteristics & Trends go top
Updated monthly, quarterly, annually. Housing market conditions and extended detail Available in subscription edition.
4.1. Component City Characteristics go top
Principal Cities (about principal cities); Click link to view city profile.
• Anaheim
• Arcadia
• Burbank
• Carson
• Costa Mesa
• Fountain Valley
• Gardena
• Glendale
• Irvine
• Long Beach
• Los Angeles
• Monterey Park
• Newport Beach
• Orange
• Pasadena
• Santa Ana
• Santa Monica
• Torrance
• Tustin
Cities 10,000 population and over; click link to view city profile.
| Area | Census 2010 | July 1 2010 | July 1 2011 | July 1 2012 | July 1 2013 | July 1 2014 | Change 2010-14 | %Change 2010-14 |
| Agoura Hills, CA (0600394) | 20,330 | 20,343 | 20,523 | 20,638 | 20,742 | 20,843 | 500 | 2.50 |
| Alhambra, CA (0600884) | 83,089 | 83,186 | 83,796 | 84,496 | 84,935 | 85,569 | 2,383 | 2.90 |
| Aliso Viejo, CA (0600947) | 47,823 | 48,207 | 48,953 | 49,602 | 50,189 | 50,231 | 2,024 | 4.20 |
| Anaheim, CA (0602000) | 336,265 | 337,280 | 340,830 | 343,606 | 345,923 | 346,997 | 9,717 | 2.90 |
| Arcadia, CA (0602462) | 56,364 | 56,420 | 56,812 | 57,135 | 57,706 | 58,232 | 1,812 | 3.20 |
| Artesia, CA (0602896) | 16,522 | 16,530 | 16,616 | 16,705 | 16,795 | 16,895 | 365 | 2.20 |
| Azusa, CA (0603386) | 46,361 | 46,351 | 46,632 | 47,360 | 48,015 | 48,799 | 2,448 | 5.30 |
| Baldwin Park, CA (0603666) | 75,390 | 75,465 | 75,949 | 76,540 | 76,922 | 77,119 | 1,654 | 2.20 |
| Bell, CA (0604870) | 35,477 | 35,512 | 35,746 | 35,938 | 36,121 | 36,217 | 705 | 2.00 |
| Bell Gardens, CA (0604996) | 42,072 | 42,104 | 42,347 | 42,853 | 43,043 | 43,146 | 1,042 | 2.50 |
| Bellflower, CA (0604982) | 76,616 | 76,661 | 77,134 | 77,557 | 77,959 | 78,236 | 1,575 | 2.10 |
| Beverly Hills, CA (0606308) | 34,109 | 34,148 | 34,361 | 34,611 | 34,756 | 34,871 | 723 | 2.10 |
| Brea, CA (0608100) | 39,282 | 39,438 | 39,897 | 40,269 | 41,109 | 41,508 | 2,070 | 5.20 |
| Buena Park, CA (0608786) | 80,530 | 80,832 | 81,709 | 82,329 | 83,133 | 83,105 | 2,273 | 2.80 |
| Burbank, CA (0608954) | 103,340 | 103,404 | 104,003 | 104,566 | 105,119 | 105,368 | 1,964 | 1.90 |
| Calabasas, CA (0609598) | 23,058 | 23,480 | 23,809 | 23,943 | 24,227 | 24,296 | 816 | 3.50 |
| Carson, CA (0611530) | 91,714 | 91,664 | 91,940 | 92,591 | 92,965 | 93,271 | 1,607 | 1.80 |
| Cerritos, CA (0612552) | 49,041 | 49,079 | 49,365 | 49,627 | 49,879 | 50,004 | 925 | 1.90 |
| Claremont, CA (0613756) | 34,926 | 34,969 | 35,324 | 35,479 | 35,929 | 36,054 | 1,085 | 3.10 |
| Commerce, CA (0614974) | 12,823 | 12,835 | 12,910 | 12,978 | 13,044 | 13,076 | 241 | 1.90 |
| Compton, CA (0615044) | 96,455 | 96,515 | 97,207 | 97,824 | 98,328 | 98,597 | 2,082 | 2.20 |
| Costa Mesa, CA (0616532) | 109,960 | 110,055 | 111,049 | 111,831 | 112,439 | 112,784 | 2,729 | 2.50 |
| Covina, CA (0616742) | 47,796 | 47,827 | 48,103 | 48,450 | 48,714 | 49,002 | 1,175 | 2.50 |
| Cudahy, CA (0617498) | 23,805 | 23,821 | 23,964 | 24,096 | 24,222 | 24,291 | 470 | 2.00 |
| Culver City, CA (0617568) | 38,883 | 38,904 | 39,120 | 39,387 | 39,592 | 39,691 | 787 | 2.00 |
| Cypress, CA (0617750) | 47,802 | 47,983 | 48,493 | 48,848 | 49,220 | 49,240 | 1,257 | 2.60 |
| Dana Point, CA (0617946) | 33,351 | 33,343 | 33,688 | 33,935 | 34,124 | 34,116 | 773 | 2.30 |
| Diamond Bar, CA (0619192) | 55,544 | 55,598 | 55,982 | 56,332 | 56,626 | 56,784 | 1,186 | 2.10 |
| Downey, CA (0619766) | 111,772 | 111,873 | 112,541 | 113,137 | 113,709 | 114,172 | 2,299 | 2.10 |
| Duarte, CA (0619990) | 21,321 | 21,358 | 21,480 | 21,700 | 21,805 | 22,006 | 648 | 3.00 |
| El Monte, CA (0622230) | 113,475 | 113,697 | 114,354 | 115,329 | 116,195 | 116,631 | 2,934 | 2.60 |
| El Segundo, CA (0622412) | 16,654 | 16,665 | 16,764 | 16,876 | 16,981 | 17,063 | 398 | 2.40 |
| Fountain Valley, CA (0625380) | 55,313 | 55,509 | 56,072 | 56,525 | 56,898 | 57,010 | 1,501 | 2.70 |
| Fullerton, CA (0628000) | 135,161 | 135,390 | 136,673 | 138,605 | 139,355 | 139,677 | 4,287 | 3.20 |
| Garden Grove, CA (0629000) | 170,883 | 171,285 | 173,281 | 174,379 | 175,270 | 175,078 | 3,793 | 2.20 |
| Gardena, CA (0628168) | 58,829 | 58,874 | 59,279 | 59,651 | 60,229 | 60,395 | 1,521 | 2.60 |
| Glendale, CA (0630000) | 191,719 | 191,870 | 193,214 | 194,820 | 196,805 | 200,167 | 8,297 | 4.30 |
| Glendora, CA (0630014) | 50,073 | 50,216 | 50,565 | 50,840 | 51,301 | 51,442 | 1,226 | 2.40 |
| Hawaiian Gardens, CA (0632506) | 14,254 | 14,272 | 14,355 | 14,436 | 14,517 | 14,557 | 285 | 2.00 |
| Hawthorne, CA (0632548) | 84,293 | 84,354 | 85,161 | 85,774 | 86,509 | 87,583 | 3,229 | 3.80 |
| Hermosa Beach, CA (0633364) | 19,506 | 19,517 | 19,625 | 19,741 | 19,831 | 19,891 | 374 | 1.90 |
| Huntington Beach, CA (0636000) | 189,992 | 191,402 | 193,366 | 194,852 | 198,122 | 200,809 | 9,407 | 4.90 |
| Huntington Park, CA (0636056) | 58,114 | 58,152 | 58,486 | 58,796 | 59,120 | 59,362 | 1,210 | 2.10 |
| Inglewood, CA (0636546) | 109,673 | 109,755 | 110,834 | 111,422 | 111,805 | 111,905 | 2,150 | 2.00 |
| Irvine, CA (0636770) | 212,375 | 213,366 | 220,528 | 229,680 | 237,111 | 248,531 | 35,165 | 16.50 |
| La Ca�ada Flintridge, CA (0639003) | 20,246 | 20,262 | 20,394 | 20,506 | 20,616 | 20,662 | 400 | 2.00 |
| La Habra, CA (0639290) | 60,239 | 60,406 | 61,052 | 61,466 | 61,822 | 62,066 | 1,660 | 2.70 |
| La Mirada, CA (0640032) | 48,527 | 48,566 | 48,832 | 49,073 | 49,303 | 49,459 | 893 | 1.80 |
| La Palma, CA (0640256) | 15,568 | 15,555 | 15,708 | 15,813 | 15,928 | 15,911 | 356 | 2.30 |
| La Puente, CA (0640340) | 39,816 | 39,854 | 40,128 | 40,345 | 40,591 | 40,735 | 881 | 2.20 |
| La Verne, CA (0640830) | 31,063 | 31,091 | 31,284 | 31,459 | 31,836 | 32,288 | 1,197 | 3.80 |
| Laguna Beach, CA (0639178) | 22,723 | 22,774 | 23,019 | 23,173 | 23,325 | 23,341 | 567 | 2.50 |
| Laguna Hills, CA (0639220) | 30,344 | 30,314 | 30,620 | 30,831 | 30,994 | 30,972 | 658 | 2.20 |
| Laguna Niguel, CA (0639248) | 62,979 | 63,151 | 63,893 | 64,357 | 64,707 | 65,448 | 2,297 | 3.60 |
| Laguna Woods, CA (0639259) | 16,192 | 16,077 | 16,236 | 16,347 | 16,431 | 16,415 | 338 | 2.10 |
| Lake Forest, CA (0639496) | 77,264 | 77,599 | 78,454 | 79,004 | 79,513 | 80,148 | 2,549 | 3.30 |
| Lakewood, CA (0639892) | 80,048 | 80,095 | 80,599 | 81,025 | 81,448 | 81,653 | 1,558 | 1.90 |
| Lancaster, CA (0640130) | 156,633 | 156,905 | 158,474 | 158,959 | 160,168 | 161,043 | 4,138 | 2.60 |
| Lawndale, CA (0640886) | 32,769 | 32,797 | 32,994 | 33,175 | 33,352 | 33,442 | 645 | 2.00 |
| Lomita, CA (0642468) | 20,256 | 20,276 | 20,420 | 20,588 | 20,695 | 20,768 | 492 | 2.40 |
| Long Beach, CA (0643000) | 462,257 | 462,769 | 465,825 | 469,141 | 471,480 | 473,577 | 10,808 | 2.30 |
| Los Alamitos, CA (0643224) | 11,449 | 11,430 | 11,542 | 11,625 | 11,681 | 11,716 | 286 | 2.50 |
| Los Angeles, CA (0644000) | 3,792,621 | 3,796,290 | 3,826,423 | 3,861,678 | 3,897,940 | 3,928,864 | 132,574 | 3.50 |
| Lynwood, CA (0644574) | 69,772 | 69,650 | 69,852 | 70,909 | 71,664 | 71,839 | 2,189 | 3.10 |
| Malibu, CA (0645246) | 12,645 | 12,661 | 12,741 | 12,825 | 12,913 | 12,958 | 297 | 2.30 |
| Manhattan Beach, CA (0645400) | 35,135 | 35,153 | 35,353 | 35,542 | 35,717 | 35,881 | 728 | 2.10 |
| Maywood, CA (0646492) | 27,395 | 27,413 | 27,580 | 27,723 | 27,867 | 27,937 | 524 | 1.90 |
| Mission Viejo, CA (0648256) | 93,305 | 93,281 | 94,209 | 94,965 | 96,502 | 97,209 | 3,928 | 4.20 |
| Monrovia, CA (0648648) | 36,590 | 36,614 | 36,837 | 37,027 | 37,258 | 37,415 | 801 | 2.20 |
| Montebello, CA (0648816) | 62,500 | 62,544 | 63,090 | 63,437 | 63,760 | 63,929 | 1,385 | 2.20 |
| Monterey Park, CA (0648914) | 60,269 | 60,303 | 60,676 | 60,987 | 61,298 | 61,458 | 1,155 | 1.90 |
| Newport Beach, CA (0651182) | 85,186 | 85,364 | 86,229 | 86,814 | 87,310 | 87,266 | 1,902 | 2.20 |
| Norwalk, CA (0652526) | 105,549 | 105,613 | 106,188 | 106,475 | 106,897 | 107,096 | 1,483 | 1.40 |
| Orange, CA (0653980) | 136,416 | 136,823 | 138,438 | 139,476 | 140,289 | 139,812 | 2,989 | 2.20 |
| Palmdale, CA (0655156) | 152,750 | 153,057 | 154,440 | 155,627 | 157,686 | 158,279 | 5,222 | 3.40 |
| Palos Verdes Estates, CA (0655380) | 13,438 | 13,447 | 13,520 | 13,582 | 13,653 | 13,680 | 233 | 1.70 |
| Paramount, CA (0655618) | 54,098 | 54,141 | 54,477 | 54,837 | 55,252 | 55,406 | 1,265 | 2.30 |
| Pasadena, CA (0656000) | 137,122 | 137,208 | 138,036 | 138,764 | 140,328 | 140,881 | 3,673 | 2.70 |
| Pico Rivera, CA (0656924) | 62,942 | 62,987 | 63,384 | 63,724 | 64,060 | 64,235 | 1,248 | 2.00 |
| Placentia, CA (0657526) | 50,533 | 51,000 | 51,582 | 51,999 | 52,350 | 52,397 | 1,397 | 2.70 |
| Pomona, CA (0658072) | 149,058 | 149,184 | 150,065 | 151,068 | 152,003 | 153,350 | 4,166 | 2.80 |
| Rancho Palos Verdes, CA (0659514) | 41,643 | 41,675 | 42,099 | 42,360 | 42,596 | 42,726 | 1,051 | 2.50 |
| Rancho Santa Margarita, CA (0659587) | 47,853 | 47,945 | 48,426 | 48,759 | 49,292 | 49,359 | 1,414 | 2.90 |
| Redondo Beach, CA (0660018) | 66,748 | 66,795 | 67,193 | 67,577 | 67,944 | 68,149 | 1,354 | 2.00 |
| Rosemead, CA (0662896) | 53,764 | 53,824 | 54,165 | 54,470 | 54,795 | 54,947 | 1,123 | 2.10 |
| San Clemente, CA (0665084) | 63,522 | 63,638 | 64,378 | 64,837 | 65,180 | 65,326 | 1,688 | 2.70 |
| San Dimas, CA (0666070) | 33,371 | 33,395 | 33,595 | 33,791 | 33,988 | 34,637 | 1,242 | 3.70 |
| San Fernando, CA (0666140) | 23,645 | 23,665 | 23,814 | 23,895 | 24,274 | 24,587 | 922 | 3.90 |
| San Gabriel, CA (0667042) | 39,718 | 39,748 | 39,995 | 40,211 | 40,409 | 40,519 | 771 | 1.90 |
| San Juan Capistrano, CA (0668028) | 34,593 | 34,785 | 35,219 | 35,511 | 36,001 | 36,282 | 1,497 | 4.30 |
| San Marino, CA (0668224) | 13,147 | 13,156 | 13,235 | 13,302 | 13,381 | 13,423 | 267 | 2.00 |
| Santa Ana, CA (0669000) | 324,528 | 325,513 | 328,856 | 331,684 | 335,388 | 334,909 | 9,396 | 2.90 |
| Santa Clarita, CA (0669088) | 176,320 | 176,487 | 177,843 | 179,021 | 180,207 | 181,557 | 5,070 | 2.90 |
| Santa Fe Springs, CA (0669154) | 16,223 | 16,277 | 16,553 | 16,806 | 17,120 | 17,537 | 1,260 | 7.70 |
| Santa Monica, CA (0670000) | 89,736 | 89,821 | 90,749 | 91,798 | 92,768 | 92,987 | 3,166 | 3.50 |
| Seal Beach, CA (0670686) | 24,168 | 24,118 | 24,363 | 24,536 | 24,663 | 24,662 | 544 | 2.30 |
| Sierra Madre, CA (0671806) | 10,917 | 10,924 | 10,990 | 11,049 | 11,107 | 11,165 | 241 | 2.20 |
| Signal Hill, CA (0671876) | 11,016 | 11,023 | 11,087 | 11,194 | 11,370 | 11,526 | 503 | 4.60 |
| South El Monte, CA (0672996) | 20,116 | 20,133 | 20,263 | 20,375 | 20,504 | 20,569 | 436 | 2.20 |
| South Gate, CA (0673080) | 94,396 | 94,481 | 95,079 | 95,613 | 96,082 | 96,312 | 1,831 | 1.90 |
| South Pasadena, CA (0673220) | 25,619 | 25,638 | 25,787 | 25,937 | 26,079 | 26,156 | 518 | 2.00 |
| Stanton, CA (0673962) | 38,186 | 37,921 | 38,305 | 38,505 | 38,739 | 38,719 | 798 | 2.10 |
| Temple City, CA (0678148) | 35,558 | 35,584 | 35,824 | 36,036 | 36,182 | 36,334 | 750 | 2.10 |
| Torrance, CA (0680000) | 145,438 | 145,539 | 146,461 | 147,250 | 148,048 | 148,495 | 2,956 | 2.00 |
| Tustin, CA (0680854) | 75,540 | 75,512 | 76,371 | 77,845 | 78,519 | 80,621 | 5,109 | 6.80 |
| Walnut, CA (0683332) | 29,172 | 29,218 | 29,549 | 29,982 | 30,138 | 30,214 | 996 | 3.40 |
| West Covina, CA (0684200) | 106,098 | 106,184 | 107,006 | 107,590 | 108,139 | 108,455 | 2,271 | 2.10 |
| West Hollywood, CA (0684410) | 34,399 | 34,430 | 34,645 | 34,848 | 35,417 | 35,883 | 1,453 | 4.20 |
| Westminster, CA (0684550) | 89,701 | 89,818 | 90,878 | 91,532 | 92,077 | 92,068 | 2,250 | 2.50 |
| Whittier, CA (0685292) | 85,331 | 85,391 | 85,883 | 86,397 | 86,988 | 87,318 | 1,927 | 2.30 |
| Yorba Linda, CA (0686832) | 64,234 | 64,451 | 65,765 | 66,544 | 67,178 | 67,826 | 3,375 | 5.20 |
All places time series population estimates interactive table.
4.2. Component County Characteristics go top
Updated periodically, annually. General demographics, social characteristics and extended detail Available in subscription edition.
Metropolitan areas are defined as one or more contiguous counties based on a set of demographic-economic criteria. Counties comprising the metro are shown below. For multi-county metros, this section provides insights into how the population is changing by county. Many metros changed geographic composition (counties included in the metro) between the Census 2010 vintage and the current vintage. These changes, if any, are also shown below (county is marked with **). See projections in related section.Click county code link to view county components of change.
All counties interactive tables General Demographics | Social | Economic | HousingMetropolitan areas are defined as one or more contiguous counties based on a set of demographic-economic criteria. Counties comprising the metro are shown below. For multi-county metros, this section provides insights into how the population is changing by county. Many metros changed geographic composition (counties included in the metro) between the Census 2010 vintage and the current vintage. These changes, if any, are also shown below (county is marked with **). See projections in related section.Click county code link to view county components of change.
| Area | July 1 2010 | Pct | July 1 2011 | Pct | July 1 2012 | Pct | July 1 2013 | Pct | July 1 2014 | Pct | July 1 2015 | Pct |
| Metro Summary ... more details | 12,843,875 | 100.0 | 12,952,686 | 100.0 | 13,059,779 | 100.0 | 13,165,355 | 100.0 | 13,254,397 | 100.0 | 13,340,068 | 100.0 |
| Los Angeles County, CA (06037) | 9,826,009 | 76.5 | 9,896,602 | 76.4 | 9,970,436 | 76.3 | 10,045,175 | 76.3 | 10,109,436 | 76.3 | 10,170,292 | 76.2 |
| Orange County, CA (06059) | 3,017,866 | 23.5 | 3,056,084 | 23.6 | 3,089,343 | 23.7 | 3,120,180 | 23.7 | 3,144,961 | 23.7 | 3,169,776 | 23.8 |
All counties population estimates & components of change time series interactive table.
4.2.1. RDEMS County Characteristics
Updated quarterly. For more information, see RDEMS Main.
Links open HSG1 Housing & New Residential Construction section. Select other sections from list above table.
4.3. General Demographic Characteristics
Updated annually. For more information, detail & to compare areas use interactive table.
| Item | 2013 | 2014 | Change 2013-14 | %Change 2013-14 |
| Total Population: Race/Origin | 13,131,431 | 13,262,220 | 130,789 | 1.00 |
| One race | 12,644,663 | 12,735,906 | 91,243 | 0.72 |
| White | 7,326,886 | 7,295,860 | -31,026 | -0.42 |
| Black/African American | 7,326,886 | 7,295,860 | -31,026 | -0.42 |
| American Indian/Alaska Native | 76,638 | 77,674 | 1,036 | 1.35 |
| Asian alone | 1,995,734 | 2,049,237 | 53,503 | 2.68 |
| Native Hawaiian/Pacific Islander | 36,628 | 37,534 | 906 | 2.47 |
| Some other race alone | 2,324,648 | 2,393,840 | 69,192 | 2.98 |
| Two or more races | 486,768 | 526,314 | 39,546 | 8.12 |
| Hispanic or Latino (of any race) | 5,900,913 | 5,978,066 | 77,153 | 1.31 |
| Population 25 years and over | 8,695,229 | 8,860,560 | 165,331 | 1.31 |
| % high school graduate or higher | 78.6 | 79.1 | 0.5 | 0.64 |
| % bachelor's degree or higher | 31.7 | 32.1 | 0.4 | 1.26 |
| Total Households | 4,251,495 | 4,287,974 | 36,479 | 1.26 |
| Median household income ($) | 58,869 | 60,514 | 1,645 | 2.79 |
| Mean household income ($) | 85,536 | 88,098 | 2,562 | 3.00 |
| Item | 2013 | 2014 | Change 2013-14 | %Change 2013-14 |
| Total Population: Gender & Age | 13,131,431 | 13,262,220 | 130,789 | 1.00 |
| Male | 6,483,369 | 6,536,709 | 53,340 | 3.00 |
| Female | 6,648,062 | 6,725,511 | 77,449 | 3.00 |
| Under 5 years | 830,596 | 835,999 | 5,403 | 3.00 |
| 5 to 9 years | 831,422 | 824,493 | -6,929 | -0.83 |
| 10 to 14 years | 845,840 | 836,215 | -9,625 | -1.14 |
| 15 to 19 years | 913,032 | 894,636 | -18,396 | -2.01 |
| 20 to 24 years | 1,015,312 | 1,010,317 | -4,995 | -0.49 |
| 25 to 34 years | 1,977,176 | 2,016,249 | 39,073 | 1.98 |
| 35 to 44 years | 1,838,775 | 1,835,890 | -2,885 | -0.16 |
| 45 to 54 years | 1,827,063 | 1,847,701 | 20,638 | 1.13 |
| 55 to 59 years | 807,510 | 833,162 | 25,652 | 3.18 |
| 55 to 59 years | 807,510 | 833,162 | 25,652 | 3.18 |
| 60 to 64 years | 660,517 | 681,197 | 20,680 | 3.13 |
| 65 to 74 years | 877,346 | 920,617 | 43,271 | 4.93 |
| 75 to 84 years | 476,502 | 499,677 | 23,175 | 4.86 |
| 85 years and over | 230,340 | 226,067 | -4,273 | -1.86 |
| Median age | 35.8 | 36.1 | 0.3 | 0.84 |
| 18 years and over | 10,081,702 | 10,236,630 | 154,928 | 1.54 |
| 21 years and over | 9,507,883 | 9,671,948 | 164,065 | 1.73 |
| 62 years and over | 1,960,237 | 2,035,428 | 75,191 | 3.84 |
| 65 years and over | 1,584,188 | 1,646,361 | 62,173 | 3.92 |
5. Housing Characteristics & Trends go top
Updated monthly, quarterly, annually. Housing market conditions and extended detail Available in subscription edition.
5.1. Total Housing Units
Updated Annually. Independent annual model-based estimates. For more information, detail & to compare areas use interactive table.
| Item | Census 2010 | July 1 2010 | July 1 2011 | July 1 2012 | July 1 2013 | July 1 2014 | Change 2010-2014 | %Change 2010-2014 |
| Total Housing Units | 4,493,983 | 4,495,328 | 4,503,761 | 4,515,990 | 4,531,387 | 4,554,527 | 59,199 | 1.32 |
5.2. General Housing Characteristics
Updated Annually. For more information, detail & to compare areas use interactive table.
| Item | 2013 | 2014 | Change 2013-14 | %Change 2013-14 |
| Housing Units: Units in Structure | 4,522,461 | 4,554,759 | 32,298 | 0.71 |
| 1-unit, detached | 2,261,009 | 2,267,617 | 6,608 | 0.29 |
| 1-unit, attached | 346,596 | 361,833 | 15,237 | 4.40 |
| 2 units | 97,022 | 114,170 | 17,148 | 17.67 |
| 3 or 4 units | 275,611 | 271,192 | -4,419 | -1.60 |
| 5 to 9 units | 347,293 | 339,191 | -8,102 | -2.33 |
| 10 to 20 units | 326,833 | 330,635 | 3,802 | 1.16 |
| 20 or more units | 783,317 | 778,391 | -4,926 | -0.63 |
| Item | 2013 | 2014 | Change 2013-14 | %Change 2013-14 |
| Housing Units: Occupancy & Tenure | 4,522,461 | 4,554,759 | 32,298 | 0.71 |
| Occupied Housing Units | 4,251,495 | 4,287,974 | 36,479 | 0.86 |
| Owner | 2,055,136 | 2,071,774 | 16,638 | 0.81 |
| Renter | 2,196,359 | 2,216,200 | 19,841 | 0.90 |
| Vacant Housing Units | 270,966 | 266,785 | -4,181 | -1.54 |
| Homeowner vacancy rate | 1.00 | 1.00 | 0.00 | ... |
| Rental vacancy rate | 3.70 | 3.30 | -0.40 | ... |
| Average household size; owner-occ | 3.15 | 3.15 | 0.00 | 0.00 |
| Average household size; renter-occ | 2.93 | 2.94 | 0.01 | 0.34 |
| Median Value $ owner occupied | 453,500 | 494,900 | 41,400 | 9.13 |
| Median Rent $ renter occupied | 1,265 | 1,309 | 44 | 3.48 |
5.3. Residential Construction; Housing Units Authorized & Value
Updated Monthly. 12 most recent months. For more information, detail & to compare areas use interactive table.
| Item | Aug15 | Sep15 | Oct15 | Nov15 | Dec15 | Jan16 | Feb16 | Mar16 | Apr16 | May16 | Jun16 | Jul16 |
| Total Residential Units | 2,365 | 3,638 | 1,498 | 3,724 | 2,258 | 2,129 | 2,769 | 2,723 | 2,979 | 3,770 | 2,513 | 2,104 |
| in 1 unit bldgs | 709 | 647 | 760 | 646 | 661 | 498 | 644 | 958 | 852 | 1,030 | 1,023 | 639 |
| in 2 unit bldgs | 74 | 54 | 62 | 72 | 54 | 58 | 92 | 52 | 56 | 84 | 76 | 58 |
| in 3-4 unit bldgs | 37 | 17 | 18 | 11 | 39 | 6 | 25 | 61 | 39 | 50 | 25 | 61 |
| in 5+ unit bldgs | 1,545 | 2,920 | 658 | 2,995 | 1,504 | 1,567 | 2,008 | 1,652 | 2,032 | 2,606 | 1,389 | 1,346 |
| Bldgs with 5+ units | 42 | 66 | 34 | 38 | 82 | 31 | 47 | 61 | 44 | 49 | 44 | 57 |
| Percent Coverage | 100 | 100 | 100 | 100 | 100 | 100 | 100 | 100 | 100 | 100 | 100 | 100 |
| Value ($000), Total Units | 545,340 | 648,344 | 410,930 | 804,593 | 517,607 | 348,802 | 586,204 | 712,324 | 658,331 | 722,990 | 596,417 | 538,686 |
| 1 unit structures | 273,401 | 244,681 | 288,250 | 243,174 | 255,574 | 187,328 | 210,286 | 346,936 | 288,209 | 329,069 | 361,114 | 260,154 |
| 2 unit structures | 13,953 | 10,835 | 12,550 | 12,807 | 10,735 | 11,018 | 19,166 | 9,887 | 10,868 | 17,213 | 15,133 | 11,866 |
| 3-4 unit structures | 8,479 | 3,486 | 4,684 | 1,994 | 7,417 | 2,111 | 5,540 | 13,685 | 8,157 | 10,379 | 4,902 | 10,303 |
| 5+ unit structures | 249,507 | 389,342 | 105,446 | 546,618 | 243,881 | 148,345 | 351,212 | 341,816 | 351,097 | 366,329 | 215,268 | 256,363 |
5.4. Housing Price Index go top
Updated quarterly. All transactions; not seasonally adjusted. See related Housing Price Index (HPI) interactive table.
See related 5-Digit ZIP Code HPI interactive table.
| Housing Price Index: | 2015Q3 | 2015Q4 | 2016Q1 | 2016Q2 | 2016Q3 |
| 297.73 | 302.24 | 306.17 | 310.34 | 316.31 | |
| Quarter-to-Quarter/Year Percent Change: | 2015Q3-2015Q4 | 2015Q4-2016Q1 | 2016Q1-2016Q2 | 2016Q2-2016Q3 | 2015Q3-2016Q3 |
| 1.51 | 1.30 | 1.36 | 1.92 | 6.24 |
6.1. Economic Profile go top
The Economic Profile shows shows derivation and key components of total personal income. Data are organized by place of residence and place of work. The place of residence profile includes estimates of total personal income, population, and per capita personal income. The place of work profile includes estimates of total earnings, total employment and average earnings per job. Updated annually. See related interactive table.
Dollar items are in current dollars (not adjusted for inflation). Per capita items in dollars; other dollar items in thousands of dollars.
See related notes.
| Item | 2011 | 2012 | 2013 | 2014 | 2015 | Change 2011-2015 | %Change 2011-2015 |
| Personal income | 611,966,806 | 656,317,042 | 649,948,396 | 687,298,095 | 727,377,241 | 115,410,435 | 18.9 |
| Net earnings 1/ | 397,017,896 | 422,017,070 | 419,131,175 | 438,252,950 | 464,765,176 | 67,747,280 | 17.1 |
| Personal current transfer receipts | 95,217,632 | 96,249,969 | 99,937,606 | 106,235,276 | 115,017,574 | 19,799,942 | 20.8 |
| Income maintenance 2/ | 13,041,562 | 13,102,270 | 13,384,058 | 13,579,163 | 13,561,104 | 519,542 | 4.0 |
| Unemployment insurance compensation | 5,526,339 | 4,365,625 | 3,352,305 | 1,824,446 | 1,540,783 | -3,985,556 | -72.1 |
| Retirement and other | 76,649,731 | 78,782,074 | 83,201,243 | 90,831,667 | 99,915,687 | 23,265,956 | 30.4 |
| Dividends, interest, and rent 3/ | 119,731,278 | 138,050,003 | 130,879,615 | 142,809,869 | 147,594,491 | 27,863,213 | 23.3 |
| Population 4/ | 12,952,686 | 13,059,779 | 13,165,355 | 13,254,397 | 13,340,068 | 387,382 | 3.0 |
| Per capita personal income | 47,246 | 50,255 | 49,368 | 51,854 | 54,526 | 7,280 | 15.4 |
| Per capita net earnings | 30,651 | 32,314 | 31,836 | 33,065 | 34,840 | 4,189 | 13.7 |
| Per capita personal current transfer receipts | 7,351 | 7,370 | 7,591 | 8,015 | 8,622 | 1,271 | 17.3 |
| Per capita income maintenance | 1,007 | 1,003 | 1,017 | 1,025 | 1,017 | 10 | 1.0 |
| Per capita unemployment insurance compensation | 427 | 334 | 255 | 138 | 116 | -311 | -72.8 |
| Per capita retirement and other | 5,918 | 6,032 | 6,320 | 6,853 | 7,490 | 1,572 | 26.6 |
| Per capita dividends, interest, and rent | 9,244 | 10,571 | 9,941 | 10,775 | 11,064 | 1,820 | 19.7 |
| Earnings by place of work | 458,898,419 | 486,126,799 | 490,323,862 | 512,089,866 | 541,540,504 | 82,642,085 | 18.0 |
| Wages and salaries | 309,661,299 | 325,746,860 | 331,522,630 | 349,306,609 | 371,842,951 | 62,181,652 | 20.1 |
| Supplements to wages and salaries | 77,302,071 | 77,611,470 | 80,803,038 | 83,769,853 | 87,180,272 | 9,878,201 | 12.8 |
| Employer cont. for empl. pension & insur. funds 6/ | 55,483,174 | 54,868,245 | 57,457,739 | 59,252,416 | 61,456,109 | 5,972,935 | 10.8 |
| Employer cont. for government social insurance | 21,818,897 | 22,743,225 | 23,345,299 | 24,517,437 | 25,724,163 | 3,905,266 | 17.9 |
| Proprietors' income | 71,935,049 | 82,768,469 | 77,998,194 | 79,013,404 | 82,517,281 | 10,582,232 | 14.7 |
| Nonfarm proprietors' income | 22,120 | 19,700 | 10,429 | 4,873 | 32,819 | 10,699 | 48.4 |
| Farm proprietors' income | 71,912,929 | 82,748,769 | 77,987,765 | 79,008,531 | 82,484,462 | 10,571,533 | 14.7 |
| Total full-time and part-time employment | 7,407,448 | 7,690,070 | 7,929,444 | 8,155,027 | 8,357,951 | 950,503 | 12.8 |
| Wage and salary jobs | 5,521,774 | 5,756,854 | 5,926,791 | 6,066,173 | 6,200,870 | 679,096 | 12.3 |
| Number of proprietors | 1,885,674 | 1,933,216 | 2,002,653 | 2,088,854 | 2,157,081 | 271,407 | 14.4 |
| Number of nonfarm proprietors 7/ | 1,320 | 1,239 | 1,243 | 1,245 | 1,246 | -74 | -5.6 |
| Number of farm proprietors | 1,884,354 | 1,931,977 | 2,001,410 | 2,087,609 | 2,155,835 | 271,481 | 14.4 |
| Average earnings per job (dollars) | 61,951 | 63,215 | 61,836 | 62,794 | 64,793 | 2,842 | 4.6 |
| Average wages and salaries | 56,080 | 56,584 | 55,936 | 57,583 | 59,966 | 3,886 | 6.9 |
| Average nonfarm proprietors' income | 38,163 | 42,831 | 38,966 | 37,846 | 38,261 | 98 | 0.3 |
See related notes.
6.2. Cost of Living Indexes go top
Updated periodically. Available in subscription edition.
6.3. Cost of Doing Business Indexes go top
Updated periodically. Available in subscription edition.
6.4. Consumer Price Index go top
Updated monthly. Available in subscription edition.
6.5. Gross Domestic Product by Sector go top
Updated quarterly, annually. For more information, detail & to compare areas use interactive table. Additional detail in subscription edition.
| Item | 2009 | 2010 | 2011 | 2012 | 2013 | 2014 | Change 2009-14 | %Change 2009-14 |
| Gross Domestic Product, millions of current dollars | 753,732 | 764,958 | 779,236 | 806,415 | 833,801 | 866,745 | 113,013 | 14.99 |
| Real Gross Domestic Product, millions of real dollars | 753,732 | 755,490 | 756,796 | 768,012 | 780,113 | 797,697 | 43,965 | 5.83 |
6.6. Establishments, Employment & Earnings by Detailed Type of Business go top
Updated quarterly. For more information, detail & to compare areas use interactive table.
| Sector | Establishments 2015Q1 | Employment 2015Q1 | Avg Weekly Wages 2015Q1 | Establishments 2015Q2 | Employment 2015Q2 | Avg Weekly Wages 2015Q2 |
| Total, all industries | 558,906 | 9,441,827 | 1,147 | 563,686 | 9,557,371 | 1,065 |
| Total, all industries - Fed Govt | 568 | 96,040 | 1,631 | 571 | 97,775 | 1,381 |
| Total, all industries - St Govt | 1,951 | 149,631 | 1,307 | 1,955 | 150,448 | 1,332 |
| Total, all industries - Local Govt | 4,743 | 915,769 | 1,252 | 4,744 | 930,700 | 1,230 |
| Total, all industries - Private | 551,644 | 8,280,386 | 1,127 | 556,416 | 8,378,447 | 1,038 |
| Goods-producing | 37,374 | 1,215,703 | 1,260 | 37,864 | 1,228,228 | 1,176 |
| Natural resources and mining | 653 | 19,899 | 1,521 | 660 | 20,824 | 1,137 |
| Construction | 19,588 | 339,436 | 1,125 | 19,939 | 351,070 | 1,141 |
| Manufacturing | 17,133 | 856,368 | 1,308 | 17,265 | 856,334 | 1,192 |
| Service-providing | 514,270 | 7,064,683 | 1,104 | 518,552 | 7,150,219 | 1,015 |
| Trade, transportation & utilities | 69,378 | 1,744,625 | 931 | 70,062 | 1,743,267 | 908 |
| Information | 10,602 | 368,980 | 2,156 | 10,926 | 376,046 | 1,848 |
| Financial activities | 35,005 | 538,085 | 2,130 | 35,507 | 543,822 | 1,663 |
| Professional & business services | 66,955 | 1,435,096 | 1,492 | 67,957 | 1,445,488 | 1,320 |
| Education and health services | 234,066 | 1,504,008 | 821 | 236,536 | 1,527,642 | 838 |
| Leisure and hospitality | 38,646 | 1,097,720 | 541 | 39,475 | 1,138,896 | 551 |
| Other services | 34,208 | 309,284 | 668 | 34,754 | 316,043 | 671 |
| Unclassified | 25,410 | 66,886 | 797 | 23,335 | 59,015 | 841 |
Notes: cell value of '...' indicates value suppressed to maintain confidentiality.
Use the following links to access detailed establishment and employment data by type of business (CSV files).
.. see notes on using these files.
2013Q1 .. 2013Q2 .. 2013Q3 .. 2013Q4 .|. 2014Q1 .. 2014Q2 .. 2014Q3 .. 2014Q4 .|. 2015Q1 .. 2015Q2 .. 2015Q3 .. 2015Q4 .. 2016Q1 .. 2016Q2
6.7. Labor Market Characteristics & Trends go top
Updated monthly. Available in subscription edition.
For more information, detail & to compare areas use interactive table.
Table shows 13 most recent months.
| Item | Aug15 | Sep15 | Oct15 | Nov15 | Dec15 | Jan16 | Feb16 | Mar16 | Apr16 | May16 | Jun16 | Jul16 | Aug16 |
| Unemplymnt Rate | 6.7 | 6.2 | 6.0 | 5.8 | 5.7 | 6.0 | 5.5 | 5.0 | 4.7 | 4.3 | 5.2 | 5.5 | 5.3 |
| Unemployment | 335,812 | 308,654 | 300,484 | 291,545 | 284,141 | 297,019 | 278,494 | 252,211 | 234,584 | 214,872 | 262,943 | 281,511 | 269,874 |
| Employment | 4,660,170 | 4,678,893 | 4,692,415 | 4,702,841 | 4,707,516 | 4,678,536 | 4,740,176 | 4,759,149 | 4,777,435 | 4,778,460 | 4,778,302 | 4,832,767 | 4,839,835 |
| Labor Force | 4,995,982 | 4,987,547 | 4,992,899 | 4,994,386 | 4,991,657 | 4,975,555 | 5,018,670 | 5,011,360 | 5,012,019 | 4,993,332 | 5,041,245 | 5,114,278 | 5,109,709 |
7. Education Infrastructure go top
7.1. Component School District Characteristics go top
Districts in this metro. Updated periodically. See related School District interactive table.
| District Name | City Name | District Code | Locale Code | County | State | 2012-13 Enrollment | 2013 Total Population | Grade Relevant Pop Ages 5-17 |
| Abc Unf | Cerritos | 0601620 | 21 | 06037 | CA | 20,835 | 108,236 | 18,476 |
| Acton-Agua Dulce Unf | Acton | 0600001 | 41 | 06037 | CA | 1,542 | 12,864 | 2,024 |
| Alhambra Unf | Alhambra | 0600153 | 21 | 06037 | CA | 18,076 | 172,776 | 17,917 |
| Anaheim City | Anaheim | 0602610 | 11 | 06059 | CA | 19,126 | 203,336 | 21,144 |
| Anaheim Union High | Anaheim | 0602630 | 11 | 06059 | CA | 32,085 | 399,886 | 36,398 |
| Antelope Valley Union High | Lancaster | 0602820 | 21 | 06037 | CA | 24,816 | 381,071 | 28,633 |
| Arcadia Unf | Arcadia | 0602970 | 13 | 06037 | CA | 9,667 | 58,938 | 9,682 |
| Azusa Unf | Azusa | 0603600 | 21 | 06037 | CA | 9,755 | 68,175 | 12,621 |
| Baldwin Park Unf | Baldwin Park | 0603690 | 21 | 06037 | CA | 18,845 | 76,199 | 15,809 |
| Bassett Unf | La Puente | 0604110 | 21 | 06037 | CA | 4,194 | 27,206 | 5,400 |
| Bellflower Unf | Bellflower | 0604440 | 21 | 06037 | CA | 13,721 | 82,964 | 15,650 |
| Beverly Hills Unf | Beverly Hills | 0604830 | 21 | 06037 | CA | 4,515 | 34,840 | 5,121 |
| Bonita Unf | San Dimas | 0605610 | 21 | 06037 | CA | 9,870 | 62,480 | 9,954 |
| Brea-Olinda Unf | Brea | 0605880 | 21 | 06059 | CA | 5,972 | 36,104 | 6,078 |
| Buena Park Elem | Buena Park | 0606360 | 21 | 06059 | CA | 5,349 | 49,498 | 6,079 |
| Burbank Unf | Burbank | 0606450 | 12 | 06037 | CA | 16,481 | 105,424 | 14,708 |
| Capistrano Unf | San Juan Capistrano | 0607440 | 21 | 06059 | CA | 53,785 | 355,247 | 63,230 |
| Castaic Union Elem | Valencia | 0607740 | 21 | 06037 | CA | 2,864 | 31,034 | 2,648 |
| Centinela Valley Union High | Lawndale | 0607920 | 21 | 06037 | CA | 6,637 | 166,722 | 10,042 |
| Centralia Elem | Buena Park | 0608070 | 21 | 06059 | CA | 4,501 | 57,095 | 4,892 |
| Charter Oak Unf | Covina | 0608190 | 21 | 06037 | CA | 5,544 | 37,351 | 6,375 |
| Claremont Unf | Claremont | 0608760 | 21 | 06037 | CA | 7,018 | 42,086 | 6,132 |
| Compton Unf | Compton | 0609620 | 21 | 06037 | CA | 24,710 | 157,896 | 34,747 |
| Covina-Valley Unf | Covina | 0610050 | 21 | 06037 | CA | 12,978 | 78,843 | 14,214 |
| Culver City Unf | Culver City | 0610260 | 21 | 06037 | CA | 6,741 | 39,853 | 5,034 |
| Cypress Elem | Cypress | 0610440 | 21 | 06059 | CA | 3,879 | 45,016 | 3,678 |
| Downey Unf | Downey | 0611460 | 21 | 06037 | CA | 22,848 | 123,458 | 22,891 |
| Duarte Unf | Duarte | 0611520 | 21 | 06037 | CA | 3,749 | 28,289 | 4,492 |
| East Whittier City Elem | Whittier | 0611850 | 21 | 06037 | CA | 9,104 | 74,530 | 9,076 |
| Eastside Union Elem | Lancaster | 0611910 | 21 | 06037 | CA | 3,386 | 24,710 | 3,675 |
| El Monte City Elem | El Monte | 0612090 | 21 | 06037 | CA | 9,304 | 84,017 | 9,961 |
| El Monte Union High | El Monte | 0612120 | 21 | 06037 | CA | 9,812 | 176,068 | 10,626 |
| El Rancho Unf | Pico Rivera | 0612180 | 21 | 06037 | CA | 9,648 | 61,406 | 11,364 |
| El Segundo Unf | El Segundo | 0612210 | 21 | 06037 | CA | 3,415 | 16,930 | 2,746 |
| Fountain Valley Elem | Fountain Valley | 0614220 | 13 | 06059 | CA | 6,344 | 55,641 | 5,756 |
| Fullerton Elem | Fullerton | 0614730 | 21 | 06059 | CA | 13,830 | 122,327 | 13,708 |
| Fullerton Joint Union High | Fullerton | 0614760 | 21 | 06059 | CA | 14,608 | 258,324 | 15,106 |
| Garden Grove Unf | Garden Grove | 0614880 | 21 | 06059 | CA | 47,599 | 284,112 | 50,483 |
| Garvey Elem | Rosemead | 0614940 | 21 | 06037 | CA | 5,259 | 54,189 | 5,577 |
| Glendale Unf | Glendale | 0615240 | 12 | 06037 | CA | 26,179 | 218,205 | 29,532 |
| Glendora Unf | Glendora | 0615270 | 21 | 06037 | CA | 7,559 | 38,339 | 6,761 |
| Gorman Elem | Gorman | 0615600 | 13 | 06037 | CA | 1,740 | 175 | 19 |
| Hacienda La Puente Unf | City Of Industry | 0616325 | 21 | 06037 | CA | 20,358 | 118,918 | 21,607 |
| Hawthorne | Hawthorne | 0616680 | 21 | 06037 | CA | 9,027 | 75,149 | 9,604 |
| Hermosa Beach City Elem | Hermosa Beach | 0617040 | 21 | 06037 | CA | 2,667 | 19,896 | 2,011 |
| Hughes-Elizabeth Lakes Union Elem | Lake Hughes | 0617880 | 42 | 06037 | CA | 281 | 3,842 | 338 |
| Huntington Beach City Elem | Huntington Beach | 0618030 | 21 | 06059 | CA | 7,056 | 85,746 | 7,534 |
| Huntington Beach Union High | Huntington Beach | 0618060 | 21 | 06059 | CA | 16,400 | 322,997 | 17,037 |
| Inglewood Unf | Inglewood | 0618390 | 21 | 06037 | CA | 14,207 | 114,273 | 20,322 |
| Irvine Unf | Irvine | 0684500 | 12 | 06059 | CA | 29,072 | 192,615 | 29,175 |
| Keppel Union Elem | Pearblossom | 0619440 | 41 | 06037 | CA | 2,747 | 21,322 | 2,791 |
| La Canada Unf | La Canada | 0620130 | 21 | 06037 | CA | 4,119 | 18,048 | 3,873 |
| La Habra City Elem | La Habra | 0620190 | 21 | 06059 | CA | 5,251 | 51,129 | 6,316 |
| Laguna Beach Unf | Laguna Beach | 0620370 | 21 | 06059 | CA | 3,045 | 29,914 | 3,556 |
| Lancaster Elem | Lancaster | 0620880 | 21 | 06037 | CA | 14,713 | 114,946 | 16,074 |
| Las Virgenes Unf | Calabasas | 0621000 | 21 | 06037 | CA | 11,200 | 65,238 | 12,271 |
| Lawndale Elem | Lawndale | 0621210 | 21 | 06037 | CA | 6,325 | 49,112 | 6,129 |
| Lennox | Lennox | 0621420 | 21 | 06037 | CA | 7,043 | 29,719 | 4,393 |
| Little Lake City Elem | Santa Fe Springs | 0621930 | 21 | 06037 | CA | 4,642 | 34,438 | 4,145 |
| Long Beach Unf | Long Beach | 0622500 | 11 | 06037 | CA | 82,256 | 521,264 | 87,044 |
| Los Alamitos Unf | Los Alamitos | 0622590 | 21 | 06059 | CA | 9,912 | 50,372 | 7,101 |
| Los Angeles Unf | Los Angeles | 0622710 | 11 | 06037 | CA | 655,455 | 4,632,930 | 740,867 |
| Los Nietos | Whittier | 0622890 | 21 | 06037 | CA | 1,925 | 15,301 | 1,984 |
| Lowell Joint | Whittier | 0623010 | 21 | 06037 | CA | 3,169 | 35,370 | 3,730 |
| Lynwood Unf | Lynwood | 0623160 | 21 | 06037 | CA | 15,029 | 69,779 | 16,007 |
| Magnolia Elem | Anaheim | 0623430 | 11 | 06059 | CA | 6,353 | 64,188 | 6,394 |
| Manhattan Beach Unf | Manhattan Beach | 0600025 | 21 | 06037 | CA | 6,832 | 35,845 | 6,413 |
| Monrovia Unf | Monrovia | 0625320 | 21 | 06037 | CA | 5,936 | 44,139 | 7,002 |
| Montebello Unf | Montebello | 0625470 | 21 | 06037 | CA | 30,564 | 167,095 | 32,556 |
| Mountain View Elem | El Monte | 0626190 | 21 | 06037 | CA | 7,618 | 58,166 | 8,308 |
| Newhall | Valencia | 0627180 | 21 | 06037 | CA | 6,947 | 75,148 | 7,375 |
| Newport-Mesa Unf | Costa Mesa | 0627240 | 12 | 06059 | CA | 22,003 | 202,104 | 27,566 |
| Norwalk-La Mirada Unf | Norwalk | 0627690 | 21 | 06037 | CA | 19,770 | 127,612 | 22,918 |
| Ocean View | Huntington Beach | 0628140 | 21 | 06059 | CA | 9,418 | 94,841 | 9,958 |
| Orange Unf | Orange | 0628650 | 12 | 06059 | CA | 29,854 | 225,173 | 37,085 |
| Palmdale Elem | Palmdale | 0629580 | 21 | 06037 | CA | 21,264 | 132,537 | 20,663 |
| Palos Verdes Peninsula Unf | Palos Verdes Estates | 0629700 | 21 | 06037 | CA | 11,864 | 62,026 | 11,067 |
| Paramount Unf | Paramount | 0629850 | 21 | 06037 | CA | 15,846 | 79,214 | 17,202 |
| Pasadena Unf | Pasadena | 0629940 | 12 | 06037 | CA | 19,540 | 206,467 | 27,377 |
| Placentia-Yorba Linda Unf | Placentia | 0630660 | 21 | 06059 | CA | 25,622 | 163,342 | 28,940 |
| Pomona Unf | Pomona | 0631320 | 21 | 06037 | CA | 27,186 | 170,039 | 32,928 |
| Redondo Beach Unf | Redondo Beach | 0600032 | 21 | 06037 | CA | 8,967 | 68,102 | 8,336 |
| Rosemead Elem | Rosemead | 0633570 | 21 | 06037 | CA | 2,778 | 27,727 | 2,813 |
| Rowland Unf | Rowland Heights | 0633750 | 21 | 06037 | CA | 15,501 | 111,162 | 18,202 |
| Saddleback Valley Unf | Mission Viejo | 0633860 | 21 | 06059 | CA | 30,355 | 212,470 | 35,618 |
| San Gabriel Unf | San Gabriel | 0634425 | 21 | 06037 | CA | 6,573 | 42,640 | 5,967 |
| San Marino Unf | San Marino | 0634860 | 21 | 06037 | CA | 3,150 | 15,308 | 3,142 |
| Santa Ana Unf | Santa Ana | 0635310 | 11 | 06059 | CA | 57,410 | 263,974 | 54,420 |
| Santa Monica-Malibu Unf | Santa Monica | 0635700 | 13 | 06037 | CA | 11,417 | 111,086 | 11,185 |
| Saugus Union | Santa Clarita | 0635970 | 21 | 06037 | CA | 10,178 | 104,192 | 10,947 |
| Savanna Elem | Anaheim | 0636030 | 11 | 06059 | CA | 2,398 | 30,250 | 2,700 |
| South Pasadena Unf | South Pasadena | 0637500 | 21 | 06037 | CA | 4,652 | 26,138 | 4,476 |
| South Whittier Elem | Whittier | 0637560 | 21 | 06037 | CA | 3,303 | 29,395 | 4,142 |
| Sulphur Springs Union | Canyon Country | 0638220 | 21 | 06037 | CA | 5,553 | 62,177 | 6,144 |
| Temple City Unf | Temple City | 0638980 | 21 | 06037 | CA | 5,799 | 35,310 | 5,648 |
| Torrance Unf | Torrance | 0639420 | 12 | 06037 | CA | 24,324 | 148,032 | 23,269 |
| Tustin Unf | Tustin | 0640150 | 13 | 06059 | CA | 23,771 | 136,669 | 24,956 |
| Valle Lindo Elem | South El Monte | 0640650 | 21 | 06037 | CA | 1,240 | 6,158 | 713 |
| Walnut Valley Unf | Walnut | 0641280 | 21 | 06037 | CA | 14,661 | 57,803 | 9,768 |
| West Covina Unf | West Covina | 0642000 | 21 | 06037 | CA | 14,460 | 59,823 | 10,733 |
| Westminster Elem | Westminster | 0642150 | 21 | 06059 | CA | 9,619 | 86,769 | 10,185 |
| Westside Union Elem | Quartz Hill | 0642120 | 21 | 06037 | CA | 8,645 | 73,176 | 8,709 |
| Whittier City Elem | Whittier | 0642450 | 21 | 06037 | CA | 5,849 | 68,875 | 7,991 |
| Whittier Union High | Whittier | 0642480 | 21 | 06037 | CA | 13,486 | 222,540 | 14,034 |
| William S. Hart Union High | Santa Clarita | 0642510 | 21 | 06037 | CA | 26,373 | 272,550 | 25,668 |
| Wilsona Elem | Palmdale | 0642810 | 41 | 06037 | CA | 1,393 | 10,361 | 1,564 |
| Wiseburn Elem | Hawthorne | 0642990 | 21 | 06037 | CA | 3,876 | 12,742 | 1,324 |
Number of districts: 107 ... Total enrollment: 2,046,137
All school districts interactive tables General Demographics | Social | Economic | Housing
All school districts enrollment & adminstratively reported data interactive table.
7.2. Component Higher Education Institution Characteristics go top
2014-15 School Year. Extended detail Available in subscription edition.
| Institution | City Name | Code | Level | Total UG Enrollment | Fulltime UG Enrollment | Total Grad Enrollment | Fulltime Grad Enrollment |
| Academy of Couture Art | Beverly Hills, CA | 475635 | 5 | 22 | 14 | 0 | 0 |
| Advanced College | South Gate, CA | 444343 | 3 | 125 | 125 | 0 | 0 |
| Advanced Computing Institute | Los Angeles, CA | 481234 | 4 | 354 | 354 | 0 | 0 |
| Allied American University | Laguna Hills, CA | 460729 | 5 | 2,244 | 903 | 0 | 0 |
| American Academy of Dramatic Arts-Los Angeles | Los Angeles, CA | 108852 | 4 | 280 | 280 | 0 | 0 |
| American Career College-Anaheim | Anaheim, CA | 441052 | 3 | 1,415 | 1,415 | 0 | 0 |
| American Career College-Los Angeles | Los Angeles, CA | 109040 | 3 | 1,613 | 1,613 | 0 | 0 |
| American College of Healthcare | Huntington Park, CA | 483009 | 4 | 104 | 104 | 0 | 0 |
| American Jewish University | Los Angeles, CA | 116846 | 7 | 101 | 92 | 103 | 83 |
| American Medical Sciences Center | Glendale, CA | 461263 | 4 | 84 | 84 | 0 | 0 |
| American University of Health Sciences | Signal Hill, CA | 433004 | 7 | 274 | 274 | 8 | 8 |
| Angeles College | Los Angeles, CA | 457299 | 5 | 94 | 62 | 0 | 0 |
| Antelope Valley College | Lancaster, CA | 109350 | 3 | 14,578 | 4,410 | 0 | 0 |
| Antioch University-Los Angeles | Culver City, CA | 245838 | 8 | 389 | 74 | 628 | 557 |
| Argosy University-Los Angeles | Los Angeles, CA | 447272 | 9 | 298 | 130 | 273 | 80 |
| Argosy University-Orange County | Orange, CA | 436438 | 9 | 222 | 90 | 384 | 134 |
| Art Center College of Design | Pasadena, CA | 109651 | 7 | 1,824 | 1,578 | 221 | 162 |
| Azusa Pacific Online University | Glendora, CA | 474863 | 7 | 1,315 | 770 | 139 | 37 |
| Azusa Pacific University | Azusa, CA | 109785 | 9 | 5,918 | 5,400 | 4,054 | 1,909 |
| Bethesda University of California | Anaheim, CA | 110060 | 9 | 272 | 228 | 59 | 44 |
| Biola University | La Mirada, CA | 110097 | 9 | 4,373 | 4,268 | 1,985 | 877 |
| Brandman University | Irvine, CA | 262086 | 9 | 3,990 | 1,478 | 3,805 | 1,508 |
| Bristol University | Anaheim, CA | 397270 | 7 | 49 | 49 | 13 | 13 |
| Bryan University | Los Angeles, CA | 110219 | 6 | 1,324 | 1,324 | 34 | 34 |
| CBD College | Los Angeles, CA | 439367 | 3 | 411 | 411 | 0 | 0 |
| California Career College | Canoga Park, CA | 447713 | 3 | 94 | 0 | 0 | 0 |
| California Healing Arts College | Carson, CA | 442985 | 4 | 44 | 44 | 0 | 0 |
| California Institute of Technology | Pasadena, CA | 110404 | 9 | 983 | 983 | 1,226 | 1,226 |
| California Institute of the Arts | Valencia, CA | 111081 | 9 | 970 | 961 | 501 | 498 |
| California State Polytechnic University-Pomona | Pomona, CA | 110529 | 9 | 22,395 | 19,717 | 1,571 | 604 |
| California State University-Dominguez Hills | Carson, CA | 110547 | 8 | 12,682 | 8,796 | 2,005 | 1,005 |
| California State University-Fullerton | Fullerton, CA | 110565 | 9 | 32,726 | 26,762 | 5,402 | 2,462 |
| California State University-Long Beach | Long Beach, CA | 110583 | 9 | 31,643 | 27,227 | 5,166 | 2,865 |
| California State University-Los Angeles | Los Angeles, CA | 110592 | 9 | 20,681 | 17,745 | 3,807 | 1,812 |
| California State University-Northridge | Northridge, CA | 110608 | 9 | 35,616 | 29,341 | 4,515 | 2,296 |
| California University of Management and Sciences | Anaheim, CA | 460075 | 7 | 98 | 98 | 494 | 494 |
| Career Networks Institute | Orange, CA | 433013 | 3 | 651 | 645 | 0 | 0 |
| Carrington College California-Pomona | Pomona, CA | 467368 | 3 | 374 | 304 | 0 | 0 |
| Casa Loma College-Van Nuys | Van Nuys, CA | 111638 | 3 | 446 | 446 | 0 | 0 |
| Cerritos College | Norwalk, CA | 111887 | 4 | 21,774 | 7,254 | 0 | 0 |
| Chapman University | Orange, CA | 111948 | 9 | 6,281 | 6,004 | 1,851 | 1,322 |
| Charles R Drew University of Medicine and Science | Los Angeles, CA | 111966 | 8 | 69 | 65 | 412 | 337 |
| Charter College-Canyon Country | Canyon Country, CA | 434317 | 5 | 1,062 | 1,062 | 0 | 0 |
| Citrus College | Glendora, CA | 112172 | 4 | 12,780 | 4,921 | 0 | 0 |
| Claremont McKenna College | Claremont, CA | 112260 | 7 | 1,301 | 1,298 | 23 | 23 |
| Coast Career Institute | Los Angeles, CA | 401339 | 4 | 212 | 212 | 0 | 0 |
| Coastline Community College | Fountain Valley, CA | 112385 | 3 | 11,313 | 1,660 | 0 | 0 |
| College of the Canyons | Santa Clarita, CA | 111461 | 3 | 17,148 | 6,227 | 0 | 0 |
| Columbia College-Hollywood | Tarzana, CA | 112570 | 5 | 308 | 270 | 0 | 0 |
| Concorde Career College-Garden Grove | Garden Grove, CA | 123679 | 3 | 974 | 974 | 0 | 0 |
| Concorde Career College-North Hollywood | North Hollywood, CA | 124937 | 3 | 620 | 620 | 0 | 0 |
| Concordia University-Irvine | Irvine, CA | 112075 | 9 | 1,918 | 1,760 | 2,393 | 1,581 |
| Crimson Technical College | Inglewood, CA | 413680 | 4 | 414 | 414 | 0 | 0 |
| Cypress College | Cypress, CA | 113236 | 4 | 15,816 | 5,085 | 0 | 0 |
| DeVry University-California | Pomona, CA | 482431 | 7 | 6,467 | 3,091 | 1,465 | 284 |
| Dongguk University-Los Angeles | Los Angeles, CA | 122117 | 9 | 20 | 6 | 151 | 99 |
| Downey Adult School | Downey, CA | 371690 | 4 | 1,210 | 438 | 0 | 0 |
| East Los Angeles College | Monterey Park, CA | 113856 | 4 | 36,012 | 7,739 | 0 | 0 |
| East San Gabriel Valley Regional Occupational Program | West Covina, CA | 413802 | 3 | 581 | 221 | 0 | 0 |
| El Camino College-Compton Center | Compton, CA | 112686 | 3 | 7,611 | 1,961 | 0 | 0 |
| El Camino Community College District | Torrance, CA | 113980 | 4 | 24,207 | 8,298 | 0 | 0 |
| Everest College-Anaheim | Anaheim, CA | 371982 | 3 | 443 | 396 | 0 | 0 |
| Everest College-City of Industry | City of Industry, CA | 372037 | 3 | 889 | 782 | 0 | 0 |
| Everest College-Reseda | Reseda, CA | 119359 | 3 | 596 | 550 | 0 | 0 |
| Everest College-West Los Angeles | Los Angeles, CA | 368805 | 3 | 340 | 283 | 0 | 0 |
| Fashion Institute of Design & Merchandising-Los Angeles | Los Angeles, CA | 114354 | 5 | 3,142 | 2,773 | 0 | 0 |
| Fashion Institute of Design & Merchandising-Orange County | Irvine, CA | 114415 | 3 | 156 | 150 | 0 | 0 |
| Fremont College | Cerritos, CA | 372073 | 5 | 387 | 387 | 0 | 0 |
| Fullerton College | Fullerton, CA | 114859 | 3 | 25,051 | 8,828 | 0 | 0 |
| Glendale Career College | Glendale, CA | 115010 | 3 | 346 | 346 | 0 | 0 |
| Glendale Community College | Glendale, CA | 115001 | 3 | 15,112 | 6,865 | 0 | 0 |
| Gnomon School of Visual Effects | Hollywood, CA | 449384 | 4 | 376 | 172 | 0 | 0 |
| Golden West College | Huntington Beach, CA | 115126 | 3 | 12,394 | 4,394 | 0 | 0 |
| Grace Mission University | Fullerton, CA | 481058 | 9 | 73 | 60 | 15 | 12 |
| Harvey Mudd College | Claremont, CA | 115409 | 5 | 804 | 802 | 0 | 0 |
| Hope International University | Fullerton, CA | 120537 | 7 | 856 | 651 | 473 | 258 |
| ICDC College | Huntington Park, CA | 437662 | 3 | 2,811 | 2,409 | 0 | 0 |
| ITT Technical Institute-Culver City | Culver City, CA | 459693 | 5 | 312 | 238 | 0 | 0 |
| ITT Technical Institute-Orange | Orange, CA | 116484 | 5 | 783 | 660 | 0 | 0 |
| ITT Technical Institute-San Dimas | San Dimas, CA | 116475 | 5 | 551 | 448 | 0 | 0 |
| ITT Technical Institute-Sylmar | Sylmar, CA | 244011 | 5 | 607 | 480 | 0 | 0 |
| ITT Technical Institute-Torrance | Torrance, CA | 378406 | 5 | 453 | 373 | 0 | 0 |
| ITT Technical Institute-West Covina | San Dimas, CA | 459684 | 5 | 8 | 1 | 0 | 0 |
| InfoTech Career College | Paramount, CA | 450960 | 4 | 136 | 136 | 0 | 0 |
| InterCoast Colleges-Orange | Orange, CA | 366289 | 3 | 357 | 357 | 0 | 0 |
| Interior Designers Institute | Newport Beach, CA | 116226 | 7 | 205 | 91 | 5 | 1 |
| Irvine Valley College | Irvine, CA | 116439 | 3 | 13,157 | 4,659 | 0 | 0 |
| Kaplan College-North Hollywood | North Hollywood, CA | 118967 | 4 | 789 | 789 | 0 | 0 |
| Laguna College of Art and Design | Laguna Beach, CA | 117168 | 7 | 543 | 484 | 23 | 16 |
| Le Cordon Bleu College of Culinary Arts-Pasadena | Pasadena, CA | 423980 | 3 | 1,792 | 1,792 | 0 | 0 |
| Learnet Academy Inc | Los Angeles, CA | 483221 | 3 | 157 | 157 | 0 | 0 |
| Life Pacific College | San Dimas, CA | 117104 | 7 | 531 | 408 | 53 | 46 |
| Long Beach City College | Long Beach, CA | 117645 | 4 | 24,403 | 9,780 | 0 | 0 |
| Los Angeles City College | Los Angeles, CA | 117788 | 4 | 18,756 | 5,072 | 0 | 0 |
| Los Angeles County College of Nursing and Allied Health | Los Angeles, CA | 117803 | 3 | 204 | 0 | 0 | 0 |
| Los Angeles Film School | Hollywood, CA | 436429 | 5 | 2,284 | 2,284 | 0 | 0 |
| Los Angeles Harbor College | Wilmington, CA | 117690 | 3 | 10,145 | 2,719 | 0 | 0 |
| Los Angeles Mission College | Sylmar, CA | 117867 | 3 | 10,191 | 2,338 | 0 | 0 |
| Los Angeles Music Academy | Pasadena, CA | 446385 | 5 | 147 | 140 | 0 | 0 |
| Los Angeles ORT College-Los Angeles Campus | Los Angeles, CA | 368780 | 3 | 306 | 306 | 0 | 0 |
| Los Angeles ORT College-Van Nuys Campus | Van Nuys, CA | 381945 | 3 | 317 | 317 | 0 | 0 |
| Los Angeles Pierce College | Woodland Hills, CA | 117706 | 3 | 21,034 | 5,812 | 0 | 0 |
| Los Angeles Southwest College | Los Angeles, CA | 117715 | 3 | 6,937 | 1,315 | 0 | 0 |
| Los Angeles Trade Technical College | Los Angeles, CA | 117724 | 3 | 14,688 | 3,786 | 0 | 0 |
| Los Angeles Valley College | Valley Glen, CA | 117733 | 4 | 18,641 | 4,522 | 0 | 0 |
| Loyola Marymount University | Los Angeles, CA | 117946 | 9 | 6,184 | 5,925 | 3,331 | 2,498 |
| Marymount California University | Rancho Palos Verdes, CA | 118541 | 7 | 1,086 | 1,033 | 22 | 17 |
| Minerva Schools at Keck Graduate Institute | Claremont, CA | 484844 | 5 | 28 | 28 | 0 | 0 |
| Modern Technology School | Fountain Valley, CA | 371928 | 4 | 131 | 131 | 0 | 0 |
| Mount St Mary's College | Los Angeles, CA | 119173 | 9 | 2,668 | 2,047 | 624 | 462 |
| Mt San Antonio College | Walnut, CA | 119164 | 4 | 29,045 | 10,501 | 0 | 0 |
| Mt Sierra College | Monrovia, CA | 398130 | 5 | 467 | 318 | 0 | 0 |
| Musicians Institute | Hollywood, CA | 119270 | 5 | 1,142 | 959 | 0 | 0 |
| National Career College | Panorama City, CA | 455868 | 3 | 147 | 147 | 0 | 0 |
| National Polytechnic College | Commerce, CA | 447759 | 4 | 198 | 179 | 0 | 0 |
| New York Film Academy | Burbank, CA | 461148 | 7 | 1,453 | 1,453 | 454 | 454 |
| North-West College-Long Beach | Long Beach, CA | 484376 | 4 | 191 | 191 | 0 | 0 |
| North-West College-Santa Ana | Santa Ana, CA | 484367 | 4 | 98 | 98 | 0 | 0 |
| Occidental College | Los Angeles, CA | 120254 | 7 | 2,040 | 2,024 | 0 | 0 |
| Orange Coast College | Costa Mesa, CA | 120342 | 4 | 21,775 | 8,589 | 0 | 0 |
| Otis College of Art and Design | Los Angeles, CA | 120403 | 7 | 1,093 | 1,080 | 53 | 41 |
| PCI College | Cerritos, CA | 439871 | 4 | 94 | 94 | 0 | 0 |
| Pacific College | Costa Mesa, CA | 422695 | 5 | 274 | 274 | 0 | 0 |
| Pacific Oaks College | Pasadena, CA | 120768 | 7 | 482 | 26 | 694 | 90 |
| Pacific States University | Los Angeles, CA | 120838 | 9 | 15 | 15 | 157 | 157 |
| Pasadena City College | Pasadena, CA | 121044 | 4 | 26,611 | 10,401 | 0 | 0 |
| Pepperdine University | Malibu, CA | 121150 | 9 | 3,451 | 3,129 | 3,966 | 2,389 |
| Pinnacle College | Alhambra, CA | 123581 | 3 | 174 | 174 | 0 | 0 |
| Pitzer College | Claremont, CA | 121257 | 5 | 1,076 | 1,039 | 0 | 0 |
| Platt College-Los Angeles | Alhambra, CA | 260789 | 5 | 661 | 661 | 0 | 0 |
| Pomona College | Claremont, CA | 121345 | 5 | 1,650 | 1,638 | 0 | 0 |
| Premiere Career College | Irwindale, CA | 416458 | 4 | 399 | 399 | 0 | 0 |
| Providence Christian College | Pasadena, CA | 455770 | 5 | 91 | 89 | 0 | 0 |
| Rio Hondo College | Whittier, CA | 121886 | 3 | 16,263 | 3,800 | 0 | 0 |
| Saddleback College | Mission Viejo, CA | 122205 | 4 | 20,007 | 6,015 | 0 | 0 |
| Santa Ana College | Santa Ana, CA | 121619 | 3 | 29,590 | 4,948 | 0 | 0 |
| Santa Monica College | Santa Monica, CA | 122977 | 3 | 30,158 | 10,861 | 0 | 0 |
| Santiago Canyon College | Orange, CA | 399212 | 3 | 11,202 | 2,950 | 0 | 0 |
| Scripps College | Claremont, CA | 123165 | 6 | 972 | 963 | 16 | 15 |
| Soka University of America | Aliso Viejo, CA | 399911 | 7 | 411 | 411 | 6 | 6 |
| South Baylo University | Anaheim, CA | 123633 | 9 | 107 | 107 | 575 | 575 |
| South Coast College | Orange, CA | 123642 | 4 | 342 | 233 | 0 | 0 |
| Southern California Institute of Architecture | Los Angeles, CA | 123952 | 7 | 263 | 254 | 260 | 255 |
| Southern California Institute of Technology | Anaheim, CA | 399869 | 5 | 526 | 526 | 0 | 0 |
| Southern California University SOMA | Los Angeles, CA | 459222 | 7 | 57 | 53 | 62 | 57 |
| Southern California University of Health Sciences | Whittier, CA | 117672 | 9 | 324 | 0 | 552 | 538 |
| Stanbridge College | Irvine, CA | 446561 | 7 | 1,073 | 1,073 | 60 | 60 |
| The Art Institute of California-Argosy University Hollywood | North Hollywood, CA | 410502 | 5 | 1,602 | 977 | 0 | 0 |
| The Art Institute of California-Argosy University Los Angeles | Santa Monica, CA | 432533 | 5 | 1,436 | 1,051 | 0 | 0 |
| The Art Institute of California-Argosy University Orange County | Santa Ana, CA | 441973 | 5 | 1,417 | 768 | 0 | 0 |
| The Chicago School of Professional Psychology at Los Angeles | Los Angeles, CA | 455664 | 9 | 16 | 0 | 1,861 | 240 |
| The Master's College and Seminary | Santa Clarita, CA | 117751 | 9 | 1,189 | 1,063 | 383 | 174 |
| Touro University Worldwide | Los Alamitos, CA | 459727 | 9 | 234 | 118 | 307 | 101 |
| Trident University International | Cypress, CA | 450979 | 9 | 3,480 | 1,921 | 2,717 | 2,717 |
| United Education Institute-Huntington Park Campus | Huntington Park, CA | 124681 | 3 | 3,564 | 3,564 | 0 | 0 |
| University of Antelope Valley | Lancaster, CA | 442930 | 7 | 753 | 753 | 19 | 19 |
| University of California-Irvine | Irvine, CA | 110653 | 9 | 24,489 | 24,141 | 5,562 | 5,132 |
| University of California-Los Angeles | Los Angeles, CA | 110662 | 9 | 29,633 | 29,033 | 12,212 | 11,505 |
| University of La Verne | La Verne, CA | 117140 | 9 | 5,211 | 3,642 | 3,306 | 1,688 |
| University of Phoenix-California | Costa Mesa, CA | 484631 | 8 | 19,688 | 19,688 | 3,569 | 3,569 |
| University of Southern California | Los Angeles, CA | 123961 | 9 | 18,739 | 18,057 | 23,714 | 18,395 |
| University of the West | Rosemead, CA | 449870 | 9 | 168 | 156 | 200 | 134 |
| Valley College of Medical Careers | West Hills, CA | 449445 | 3 | 94 | 94 | 0 | 0 |
| Vanguard University of Southern California | Costa Mesa, CA | 123651 | 7 | 1,987 | 1,504 | 268 | 84 |
| West Coast Ultrasound Institute | Beverly Hills, CA | 441229 | 4 | 800 | 800 | 0 | 0 |
| West Coast University-Los Angeles | North Hollywood, CA | 443331 | 9 | 1,395 | 1,317 | 264 | 249 |
| West Coast University-Orange County | Anaheim, CA | 458210 | 5 | 1,477 | 1,330 | 0 | 0 |
| West Los Angeles College | Culver City, CA | 125471 | 3 | 10,641 | 2,105 | 0 | 0 |
| Westwood College-Anaheim | Anaheim, CA | 437848 | 5 | 588 | 395 | 0 | 0 |
| Westwood College-Los Angeles | Los Angeles, CA | 122843 | 7 | 1,690 | 1,053 | 115 | 76 |
| Westwood College-South Bay | Torrance, CA | 121381 | 5 | 441 | 312 | 0 | 0 |
| Whittier College | Whittier, CA | 125763 | 9 | 1,626 | 1,593 | 633 | 445 |
| Woodbury University | Burbank, CA | 125897 | 7 | 1,338 | 1,161 | 250 | 213 |
| World Mission University | Los Angeles, CA | 401223 | 9 | 141 | 73 | 141 | 97 |
| Wyotech-Long Beach | Long Beach, CA | 398574 | 3 | 1,136 | 1,136 | 0 | 0 |
| Yeshiva Ohr Elchonon Chabad West Coast Talmudical Seminary | Los Angeles, CA | 126076 | 5 | 163 | 163 | 0 | 0 |
Number of institutions: 176 ... Total undergraduate enrollment: 930,539
Levels: 3-Assoc degree, 4-at least 2, but < 4 years, 5-Bach degree, 6-Postbacc cert, 7 Masters degree, 8 Post-masters cert, 9 Doctors degree
8. GeoPolitics go top
Updated periodically. Voting patterns, citizen voting age population, state legislative districts, congressional districts .. in this metro.
Available in subscription edition.
Notes
• All data are for current vintage county and metro definition.
• Developed by ProximityOne -- Metro Reports (888-364-7656)
• Data sources: ProximityOne, Census Bureau, Bureau of Economic Analysis, Bureau of Labor Statistics, Federal Housing Finance Agency,
National Center for Education Statistics.
Updates go top
The subscription edition updates frequently. Selected items are listed below. Register to receive update notifications.
• Overview lead narrative; quarterly & annual/March.
• Housing Price Index (section 5.4) quarterly.
• Establishments, employment & earnings (section 6.6) quarterly.
• Economic profile and personal income (section 6.1) annual/November.
• Labor market situation (section 6.7) monthly.
• Residential construction; units authorized & value (section 5.3.) monthly.
• Population by county; annual series 2010-2016 (section 4.2.) annual/July.
• Population by county; links for individual counties (section 4.2.) annual/July.
-- includes annual data 2010-2016.
-- includes components of change; race/origin; single year of age; age group summaries.
• Total population and components of change; annual/March.
• Census tracts overview section; annual/December.
• General Demographics section updated/extended; annual/December.
• Gross Domestic Product section; annual/September.
• Higher education institutions; annual/February.
• Metro & county demographic component detailed annual estimates; annual/March.
• School districts in metro & K-12 enrollment; annual/August.
More about schedule and upcoming events ... Calendar ... Upcoming Events ... Find Event
Terms of Use go top
Situation & Outlook Reports are a proprietary resource developed by ProximityOne. There is no warranty of any type associated with any aspect of this report. The user of this document is solely responsible to any use, direct or indirect, that might be made of this document.
Related Resources go top
• Metros main page
• Current estimates and projections: states to 2030, counties & metros to 2020 by age, counties & states to 2060.
• Making Custom Metropolitan Area Maps
• Rental Market Conditions by Metropolitan Area
• Metro Gross Domestic Product
• Housing Price Index
• Establishments, Employment & Earnings
• Regional Economic Information System
• ACS 2014 1-year General Demographics ... Social Characteristics ... Economic Characteristics ... Housing Characteristics
Using this Document go top
The Situation & Outlook Report, a component of the Situation & Outlook, is a core ProximityOne information resource providing insights into characteristics and trends of counties, metropolitan areas, states and the U.S. The Report also provides a gateway to drill-down demographic, economic and business data for smaller geographic areas.
Metropolitan areas include approximately 94 percent of the U.S. population -- 85 percent in metropolitan statistical areas (MSAs) and 9 percent in micropolitan statistical areas (MISAs).
About Metropolitan Areas & Principal Cities -- scroll section go top
Metropolitan Areas are designated by OMB ("Standards for Delineating Metropolitan and Micropolitan Statistical Areas") based
mainly on Census Bureau-sourced data.
Metropolitan areas are defined as Metropolitan Statistical Areas (MSA) and Micropolitan Statistical Areas (MISA).
MSAs and MISAs are also referred to a Core-Based Statistical Areas (CBSAs).
Contiguous CBSAs are defined as Combined Statistical Areas (CSA).
By definition, metropolitan areas are comprised of one or more contiguous counties. Metropolitan areas are not single cities and typically include many cities. Metropolitan areas are comprised of urban and rural areas and often have large expanses of rural territory. A business and demographic-economic synergy exists within each metro; metros often interact with adjacent metros. The demographic-economic make-up of metros vary widely and change often. See more about metros.
Principal Cities. The largest city in each metropolitan or micropolitan statistical area is designated a "principal city." Principal cities are designated by OMB based on Census-sourced data. Additional cities qualify as principal cities if specified requirements are met concerning population size and employment. The title of each metropolitan or micropolitan statistical area consists of the names of up to three of its principal cities and the name of each state into which the metropolitan or micropolitan statistical area extends. Titles of metropolitan divisions also typically are based on principal city names but in certain cases consist of county names.
One or more principal cities are designated within each Metropolitan Statistical Area (MSA) and Micropolitan Statistical Area (MISA). The term "principal city" is defined in the OMB "Standards for Delineating Metropolitan and Micropolitan Statistical Areas." A principal city is an OMB designation applied to one or more incorporated places and/or census designated places (CDPs). The OMB standards designate a Principal City (or Cities) of a Core-Based Statistical Area (CBSA) as determined by:
a) The largest incorporated place with a 2010 Census population of at least 10,000 in the CBSA or,
if no incorporated place of at least 10,000 population is present in the CBSA,
the largest incorporated place or census designated place in the CBSA; and
b) Additional places with 2010 Census population of at least 250,000 or in which 100,000 or more persons work; and
c) Additional places with 2010 Census population of 50,000-250,000,
and number of workers working in the place meets or exceeds the number of workers living in the place; and
d) Additional places with 2010 Census population of 10,000-50,000, and at least one-third the population size of the largest place,
and in which the number of workers working in the place meets or exceeds the number of workers living in the place.
ProximityOne User Group go top
Join the ProximityOne User Group to keep up-to-date with new developments relating to metros and component geography decision-making information resources. Receive updates and access to tools and resources available only to members. Use this form to join the User Group.
Support Using these Resources go top
Learn more about accessing and using demographic-economic data and related analytical tools. Join us in a Data Analytics Lab session. There is no fee for these one-hour Web sessions. Each informal session is focused on a specific topic. The open structure also provides for Q&A and discussion of application issues of interest to participants.
Additional Information go top
ProximityOne develops geographic-demographic-economic data and analytical tools and helps organizations knit together and use diverse data in a decision-making and analytical framework. We develop custom demographic/economic estimates and projections, develop geographic and geocoded address files, and assist with impact and geospatial analyses. Wide-ranging organizations use our tools (software, data, methodologies) to analyze their own data integrated with other data. Follow ProximityOne on Twitter at www.twitter.com/proximityone. Contact us (888-364-7656) with questions about data covered in this section or to discuss custom estimates, projections or analyses for your areas of interest.
Copyright © 2018 ProximityOne