
|
|
|
.. while we might first associate K-12 school systems with children and education, they are also an important part of the economy .. jobs, business services, transportation infrastructure ... all matters affected by K-12 school system operations. Total expenditure by public school systems, mostly school districts, was $613.6 billion in fiscal year 2014, up 2.6 percent from 2013. This section provides data and data analytics tools to examine Fiscal Year 2014 sources and uses of funds data for each/all individual school districts. • Use interactive table below in this section to examine school system finances • Create/view profile for a district(s) of interest. View annual school district finances sections: .. FY 2014 (this section) .. FY 2015 .. FY 2016 (new 5/21/18) Current Spending per Student by School District, FY 2014 The following graphic shows patterns of current spending per student by school district, FY 2014, for the Houston metro area. The metro is shown with the bold red-brown boundary; counties are shown with black boundaries and shown names as white labels. Color/fill patterns and corresponding values are shown in the inset legend. School districts are labeled with FY 2014 current spending per student.  ... view developed using the CV XE GIS software. Additional Views Patterns of current spending per student by school district, FY 2014 Selected districts (blue bold boundary) in context of adjacent districts and cities (gray crosshatch) Districts are labeled with FY 2014 current spending per student. Identify tool used to show partial mini profile (item descriptions below) • Katy ISD, TX & vicinity - Houston metro .. Houston city, TX demographic-economic profile .. Fort Bend County, TX RDEMS demographic-economic tables .. Harris County, TX RDEMS demographic-economic tables .. Waller County, TX RDEMS demographic-economic tables • McKinney ISD, TX & vicinity - Dallas metro .. McKinney city, TX demographic-economic profile .. Collin County, TX RDEMS demographic-economic tables Current Spending per Student by State; Fiscal Year 2014
Interactive Table Use the interactive table below to examine characteristics of individual school districts in context of U.S. overall, states or metros. Select by state or metro and rank based on any of several selected revenue by source and per student expenditure by category. School District Revenue & Expenditure Patterns, FY 2014 -- Interactive Table .. go top Use mouse-over on header column to view extended item/column name. Click ShowAll button between Find/Queries. See usage notes below table. Related ranking tables: interactive tables. Usage Notes • Click ShowAll button between queries • Click on a column header to sort on that column; click column header again to sort in other direction. • Click ShowAll button to show all tabulation areas and restore full set of data view. • Click State to select on geographies in a selected state. • Find in Name: Key in text/area name (partial okay) in text box to right of Find-in-Name button. .. then click Find-in-Name button to locate all matches in District column (case sensitive). • Find CBSA: Key in 5-character CBSA code in text box to right of Find CBSA. .. then click Find CBSA button to locate all matches in based on CBSA column. .. CBSA: Core-Based Statistical Area (metro). • RevCols1: Click this button to view only revenue columns. • %RevCols: Click this button to view only revenue columns; revenues expressed as %. • PerStd: Click this button to view only per student columns. • Enrl Min-Max: Key in minimum enrollment in left text box, maximum enrollment in right text box. .. then click Enrl Min-Max button; table refreshes showing only districts within specified range. .. example: note that 500000 min and 1000000 max values show only two districts. • Click ShowAll button between queries View Districts in a Selected Metro To view all school districts in the Dallas, TX MSA (for example) proceed as follows: View list of metro/CBSA names and codes • Click ShowAll button. • Key in the text Dallas in the Find in Name text box and click the Find in Name button. • Visually locate the Dallas ISD row and see that the CBSA code is 19100. • Key in the text 19100 in the Find in CBSA text box. • Click ShowAll button. • Click the Find in CBSA button. • All districts in the Dallas MSA now appear; rank on any column. Column Headers & Item Descriptions - scroll section
View/Analyze Data for Selected District(s) (step-by-step Windows instructions) Click a district of interest in the table (see usage notes below table). .. the row turns blue .. right click the row and select "Copy" Open the SDFA XLS shell .. click the above link; the table shell opens in the default XLS file handler .. paste into cell C1 (where text says "1 paste here then copy" .. copy the pasted group of cells (right-click C1 and select Copy) .. paste special transpose into cell C2 (where it says "2 copy above selected and 'paste special transpose' here" ) ... right-click C2, select Paste Special, then choose Transpose, then OK Done. Illustrative comparative analysis profile for two districts .. go top .. graphic shows partial view .. open full xls profile 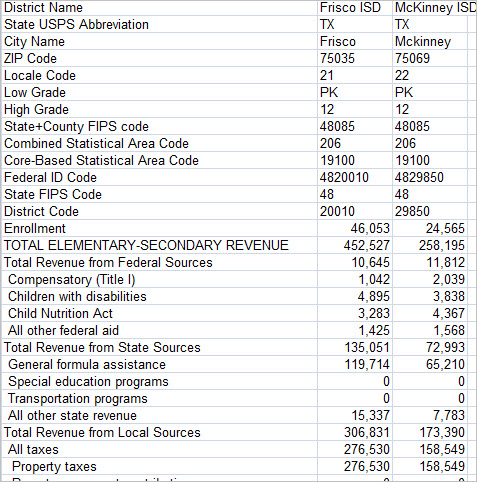 Scope of Data Data are based on an annual survey of public elementary and secondary education systems, mostly school districts, conducted by the Census Bureau under sponsorship of the U.S. Department of Education. The survey covers all U.S. school districts. Fiscal Year. With the exception of school systems in Alabama, Nebraska, Texas, Washington, and the District of Columbia, the 2014 fiscal year for school systems in all states began on July 1, 2013, and ended on June 30, 2014. AL: Oct 1 - Sept 30; NE, TX, WA: Sept 1 - August 31; DC: Oct 1 - Sept 30. Enrollment. Enrollment data are based on data reported by school districts and state education agencies for the 2013-14 school year. Total enrollment for school districts in the ranking table is 48.2 million students. Total revenue data are shown in the ranking table in thousands of dollars. Financial data are shown on cash basis. In many cases financial data will differ from financial data reported by school districts due to wide-ranging different accounting procedures used district to district. Data shown in the ranking table use standardized accounting categories across all districts except as noted in supplemental notes (not shown in this section). • List of items used in comparative analysis profile • List of extended database items • Terms and Glossary Limitations of Data These data are reported by school districts. They are not estimates subject to estimation error. However, financial data reporting and categorization differs from state to state. As a result, some data cells show as zero while in fact the data for that cell is included in another category, such as "Other." Support Using these Resources Learn more about accessing and using demographic-economic data and related analytical tools. Join us in a Data Analytics Lab session. There is no fee for these one-hour Web sessions. Each informal session is focused on a specific topic. The open structure also provides for Q&A and discussion of application issues of interest to participants. ProximityOne User Group Join the ProximityOne User Group to keep up-to-date with new developments relating to metros and component geography decision-making information resources. Receive updates and access to tools and resources available only to members. Use this form to join the User Group. Additional Information ProximityOne develops geodemographic-economic data and analytical tools and helps organizations knit together and use diverse data in a decision-making and analytical framework. We develop custom demographic/economic estimates and projections, develop geographic and geocoded address files, and assist with impact and geospatial analyses. Wide-ranging organizations use our tools (software, data, methodologies) to analyze their own data integrated with other data. Follow ProximityOne on Twitter at www.twitter.com/proximityone. Contact us (888-364-7656) with questions about data covered in this section or to discuss custom estimates, projections or analyses for your areas of interest. |
|
|