
|
|
|
-- examining state & county trends, 2010-2017 Texas Population Trends The population of Texas changed from 25,241,648 in 2010 to 28,304,596 in 2017, a change of 3,062,948 (12.13%). The change reflects 2,749,408 births and 1,271,366 deaths (1,478,042 natural increase) with 916,065 domestic migration and 658,154 international migration (1,574,219 net migration). See more about examining state, metro and county demographic-economic characteristics and trends. See related Texas Demographic-Economic Characteristics & Trends. -- extended data resources for planning and analysis Examining Sub-State Demographic Change The following map graphics show 1) the largest population counties based on 2017 population and 2) how and why county population is changing. The table presented below summarizes total population characteristics by county for the most populous counties in the state based on the 2017 estimates released in March 2018. See related all U.S. counties interactive table with extended detail. Most Populous Counties in the State - 10 most populous counties based on 2017 population shown with blue color - labels show within state 2017 population rank 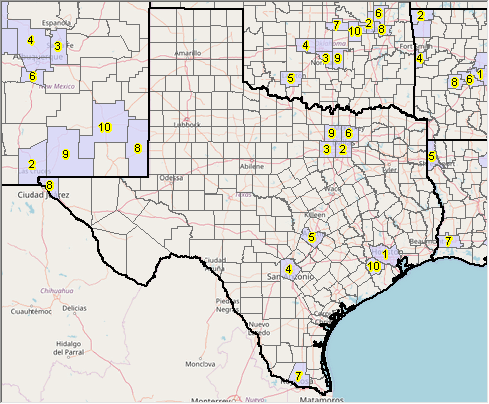 - view developed with ProximityOne CV XE GIS software - use this GIS project and data on your computer; create your own views/analyses. How and Why the Population is Changing - color patterns in the following view show how and why the population is changing by county. - largest 50 metros (population one million+) shown with brown bold boundary and short name label. 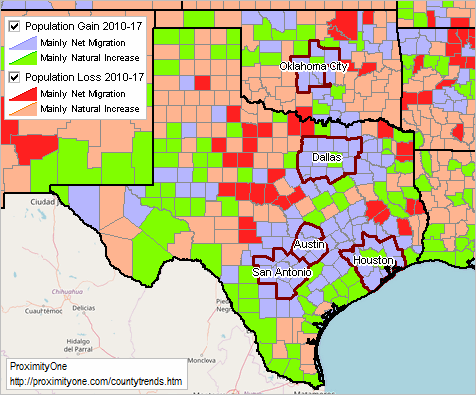 - view developed with ProximityOne CV XE GIS software - use this GIS project and data on your computer; create your own views/analyses. Texas 10 Most Populous Counties: 2017
Related Sections • County Demographic-Economic Main Section • State & Metro Housing Value & Appreciation • County & Regional Economy • County Projections to 2060 • State Demographic-Economic Main Section Sources & Uses of These Data .. goto top Current state, regional and county data on demographic characteristics and trends are essential for wide-ranging analyses and decision-making. Annually updated model-based population estimates are developed by the Census Bureau for each county. These data are official estimates used in many Federal programs and other applications. ProximityOne uses these data to develop annual projections to 2060. We integrate the population and components of change data with other data to study trends and patterns. Support Using these Resources .. goto top Learn more about accessing and using demographic-economic data and related analytical tools. Join us in a Data Analytics Lab session. There is no fee for these one-hour Web sessions. Each informal session is focused on a specific topic. The open structure also provides for Q&A and discussion of application issues of interest to participants. ProximityOne User Group Join the ProximityOne User Group to keep up-to-date with new developments relating to metros and component geography decision-making information resources. Receive updates and access to tools and resources available only to members. Use this form to join the User Group. Additional Information ProximityOne develops geodemographic-economic data and analytical tools and helps organizations knit together and use diverse data in a decision-making and analytical framework. We develop custom demographic/economic estimates and projections, develop geographic and geocoded address files, and assist with impact and geospatial analyses. Wide-ranging organizations use our tools (software, data, methodologies) to analyze their own data integrated with other data. Follow ProximityOne on Twitter at www.twitter.com/proximityone. Contact us (888-364-7656) with questions about data covered in this section or to discuss custom estimates, projections or analyses for your areas of interest. |
|
|