
|
|
School District Main Page Map Views Extended Uses of these Data Custom Maps to Meet Your Needs |
School District Demographic-Economic Characteristics 2007-2008 -- total population, K-12 school age population and school age population in poverty
Proximity integrates these data with other data to facilitate related analyses and to develop more current estimates and projections of school district demographics and alternative measures. Contact Proximity (888-364-7656) with questions about data covered in this section or to discuss custom estimates, projections or analyses for your areas of interest. School District Demographic-Economic Characteristics 2007-2008 Interactive ranking table -- view, sort, compare school district demographics for areas of interest. Click column header to sort; click again to sort other direction. Click "SDCode" link to view interactive map of school district. Column Headers SDCode - Federal school district code County - County FIPS code for primary county; some districts show no code due to missing County assignment CBSA - Core Based Statistical Area (CBSA) code for primary CBSA; blank if outside CBSA CnDist - 111th Congressional District code; some districts show no code due to missing CnDist assignment ----- 2007 Estimates ----- TotPop07 - total population Ch07 - grade relevant population age 5 to 17 years ChPv07 - grade relevant population age 5 to 17 years in poverty who are related to the householder %ChPv07 - ChPv07 as a percent of Ch07 ----- 2008 Estimates ----- TotPop08 - total population Ch08 - grade relevant population age 5 to 17 years ChPv08 - grade relevant population age 5 to 17 years in poverty who are related to the householder %ChPv08 - ChPv08 as a percent of Ch08 ----- Change, 2007-2008 ----- TotPop0708 - total population %TotPop0708 - total population, percent change 2007-2008 Ch0708 - grade relevant population age 5 to 17 years %Ch0708 - grade relevant population age 5 to 17 years, % change 07-08 ChPv0708 - grade relevant population age 5 to 17 years in poverty who are related to the householder %ChPv0708 - grade relevant population age 5 to 17 years in poverty who are related to the householder, % change 07-08 Usage Notes - A cell value of -9999.99 indicates zero population in divisor for this percentage item. - Find-in-Name feature is case-sensitive; use any part of name. - Click Show All before using Find-in-Name if not already showing all. Additional Details Both 2007 and 2008 estimates provided in the ranking table are for school districts defined as of January 1, 2008, and used to develop corresponding 2007-08 school year school district boundaries. The estimates are consistent with the population controls and income concepts used in the 2007 and 2008 American Community Survey (ACS) single-year estimates. The ACS single-year estimates cover only school districts 65,000 population or more whereas the estimates in the ranking table are for all school districts. Examining Patterns; Gaining Insights [top] The following thematic map views have been developed with the CommunityViewer GIS using data shown in the ranking table integrated into the U.S. by school district shapefile. 1. Percent Population 5-17 Years in Poverty, 2007 (item %ChPv07 in above list) 
2. Percent Population 5-17 Years in Poverty, 2008 (item %ChPv08 in above list) 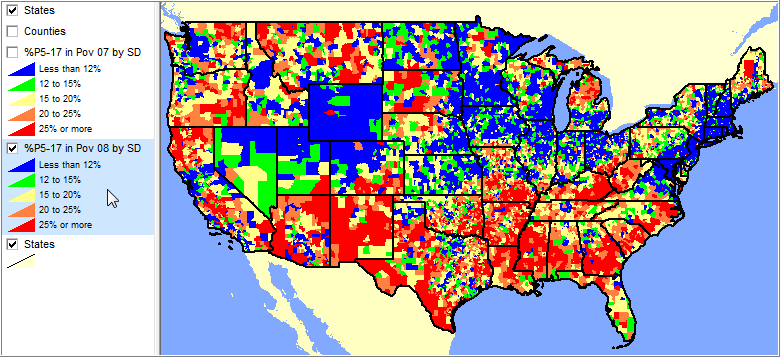
Extended Uses of These Data; Using GIS to Visualize Demographic Patterns & Trends [top] Using GIS tools, insights can be extended by adding other data/geography and viewing the data in a sub-state and regional context. The next view is similar to view 2 above but shows a zoom-in to northeastern North Carolina, labeling and additional layers. 3. Percent Population 5-17 Years in Poverty, 2008 (item %ChPv08 in above list) ... with focus on North Carolina Congressional District 1 Region (bold, black boundary) ... click map for larger, augmented view. 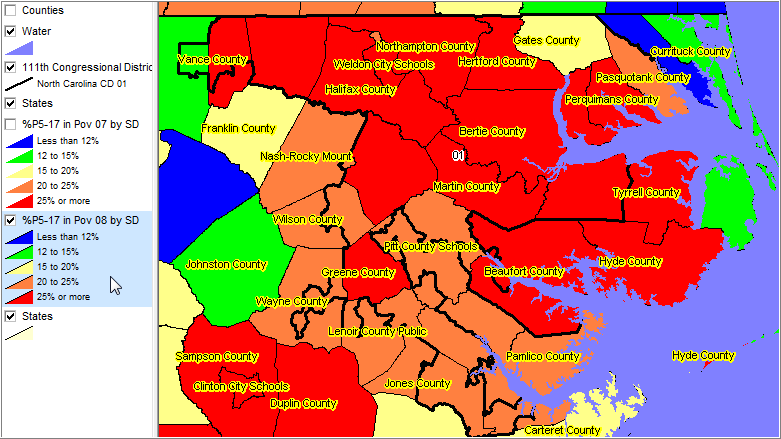
We develop custom map views to meet specific needs ... Custom Map Views, Estimates/Projections and Additional Information Proximity develops geodemographic data and analytical tools and helps organizations knit together and use diverse data in a decision-making and analytical framework. We develop custom demographic/economic estimates and projections, develop geographic and geocoded address files, and assist with impact and geospatial analyses. Wide-ranging organizations use our tools (software, data, methodologies) to analyze their own data integrated with other data. Contact Proximity (888-364-7656) with questions about data covered in this section or to discuss custom estimates, projections or analyses for your areas of interest. |
|
|