|
|
|
Interactive School Ranking Analysis Texas School District Performance Analysis Attendance Zones School District DMI Main Page |
Texas School Performance Analysis
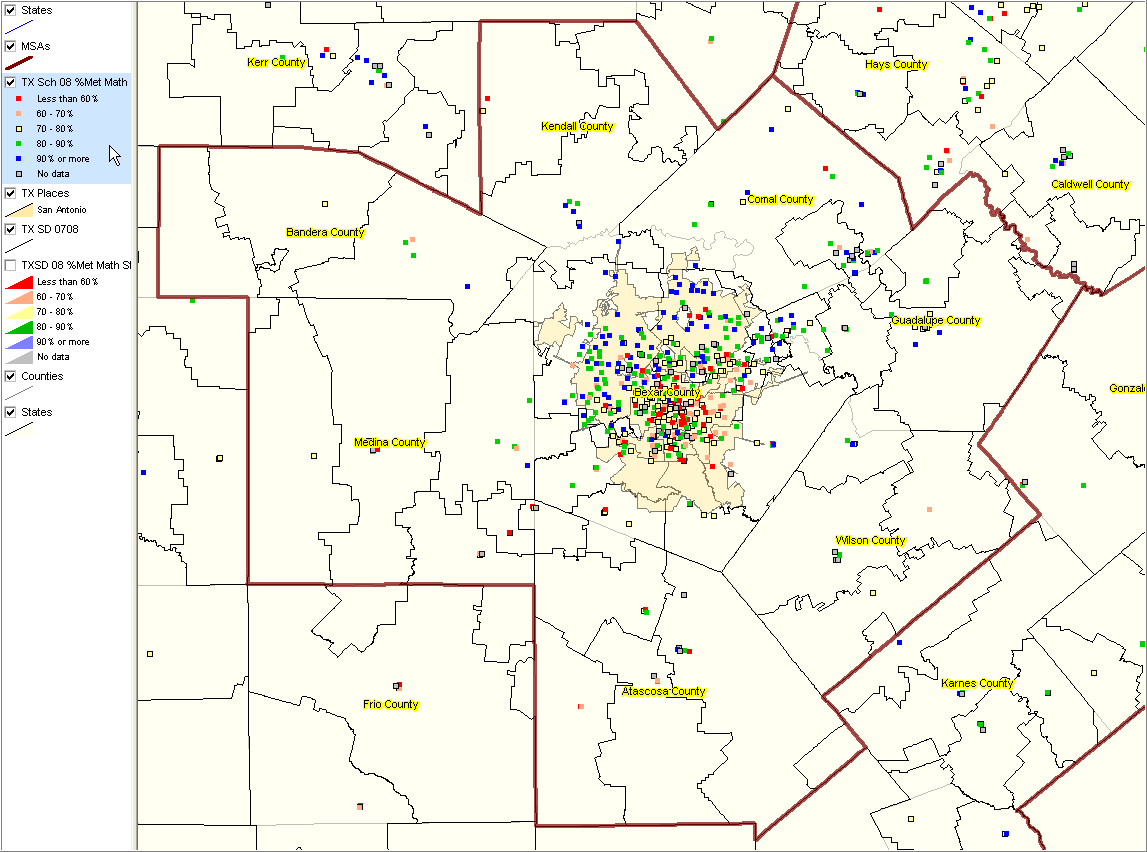 Visual Pattern Analysis. Analyze school and school district performance patterns in the context of other subject matter
and geography. The map at the right shows patterns of school performance, represented by colored markers, with the underlying data
the percent of students that met the 2008 TAKS math performance standard (all students) in the San Antonio, TX MSA/region (MSA boundary appears with brown bolder boundary).
For larger view and color pattern definitions, click on map graphic then press F11 key.
Click here then press F11 key to see alternative view with zoom-in to Bexar County, TX (San Antonio place appears with beige fill pattern; school district boundaries
appear as black bolder boundaries).
The ready-to-use GIS project enables developing analytical views for many different performance measures.
This map was prepared using CommunityViewer.
The CV GIS project is available to registered users and enables many other related wide-ranging views and analyses.
Integrate your own data.
Visual Pattern Analysis. Analyze school and school district performance patterns in the context of other subject matter
and geography. The map at the right shows patterns of school performance, represented by colored markers, with the underlying data
the percent of students that met the 2008 TAKS math performance standard (all students) in the San Antonio, TX MSA/region (MSA boundary appears with brown bolder boundary).
For larger view and color pattern definitions, click on map graphic then press F11 key.
Click here then press F11 key to see alternative view with zoom-in to Bexar County, TX (San Antonio place appears with beige fill pattern; school district boundaries
appear as black bolder boundaries).
The ready-to-use GIS project enables developing analytical views for many different performance measures.
This map was prepared using CommunityViewer.
The CV GIS project is available to registered users and enables many other related wide-ranging views and analyses.
Integrate your own data.
Texas School Performance Interactive Ranking Analysis Click column header to sort; click again to sort other direction. See related Ranking Tables Main Page Data source: Texas Education Agency; data analysis, access, tools: Proximity Column headers Campus Name Campus Code District Name Comments -- District 2008 AYP Status with Comments Final -- District 2008 AYP Status HiGrd -- Highest Grade Offered GrdLvl -- Campus Type (B, E, M, S) Total Enrollment Title1 -- Title I AYP Requirements AYP TAKS Reading CARPR07N -- 2007 Met Performance Standard, All Students, Reading Numerator CARPR07D -- 2007 Number Tested, All Students, Reading Denominator CARPR07R -- 2007 % Met Performance Standard, All Students CARPR08D -- 2008 Met Performance Standard, All Students, Reading Numerator CARPR08N -- 2008 Number Tested, All Students, Reading Denominator CARPR08R -- 2008 % Met Performance Standard, All Students AYP TAKS Math CAMPR07N -- 2007 Met Performance Standard, All Students, Math Numerator CAMPR07D -- 2007 Number Tested, All Students, Math Denominator CAMPR07R -- 2007 % Met Performance Standard, All Students CAMPR08N -- 2008 Met Performance Standard, All Students, Math Numerator CAMPR08D -- 2008 Number Tested, All Students, Math Denominator CAMPR08R -- 2008 % Met Performance Standard, All Students Graduation CAGC406N -- 2006 Completion/Student Status: Graduates, All Students Numerator CA0C406D -- 2006 Completion/Student Status: Number in Class, All Students Denominator CAGC406R -- 2006 Completion/Student Status: Graduation Rate, All Students Rate CAGC407N -- 2007 Completion/Student Status: Graduates, All Students Numerator CA0C407D -- 2007 Completion/Student Status: Number in Class, All Students Denominator CAGC407R -- 2007 Completion/Student Status: Graduation Rate, All Students Rate Campuses Included There are 8,195 campuses included in the ranking table. To view only those associated with the 1,029 conventional school districts, use the District Name Query and enter the value ISD in the edit box. |
|
|