|
|
|
Interactive School Ranking Analysis Texas School District Performance Analysis School District DMI Main Page Attendance Zones Integrated with Google Maps |
School District Attendance Zone Demographic Analysis
School attendance zones typically exist in school districts where there are multiple elementary, middle, or high schools. Defined by the school district, attendance zones are subject to discretionary change to meet the vision or needs of the school district. The most basic purpose of a school attendance zone is to define an area within the district (the attendance zone) that is less than the capacity of the corresponding school. 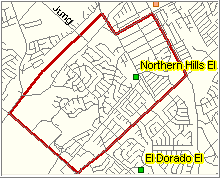 While most districts provide maps of their attendance areas, less than half of school districts have attendance areas as vector
graphics (shapefiles) in a geographic information system (GIS).
There are many educational improvement opportunities, as well as improved communications and management, that can result from use of geodemographic analyses
than can be facilitated by use of GIS. Some of these are reviewed here.
Focus of this section is on geodemographic analysis of attendance areas in the North East ISD school district located in
Bexar County/San Antonio, Texas and the Northern Hills Elementary School AA area shown in the map at right.
Applications make use of the CommunityViewer GIS (CV) and related
CV GIS project fileset.
While most districts provide maps of their attendance areas, less than half of school districts have attendance areas as vector
graphics (shapefiles) in a geographic information system (GIS).
There are many educational improvement opportunities, as well as improved communications and management, that can result from use of geodemographic analyses
than can be facilitated by use of GIS. Some of these are reviewed here.
Focus of this section is on geodemographic analysis of attendance areas in the North East ISD school district located in
Bexar County/San Antonio, Texas and the Northern Hills Elementary School AA area shown in the map at right.
Applications make use of the CommunityViewer GIS (CV) and related
CV GIS project fileset.
North East ISD school district is shown is the next graphic with blue boundary. San Antonio city is shown with yellow fill pattern. 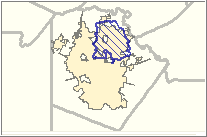
The Madison High School AA is shown in context of the district. The GIS enables depiction of map layers with alternative colors and patterns. 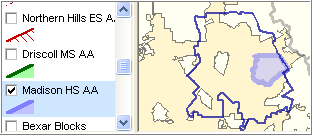
The Driscoll Middle School AA is shown in context of the district. The GIS enables selectively viewing a map layer by clicking the layer on/off in the legend. 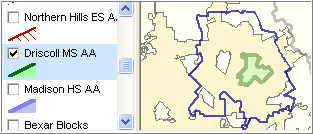
The Northern Hills Elementary School AA is shown in context of the district. 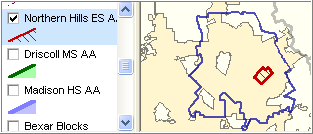
All three AAs (above) are shown together in context of broader area. - Layer transparency is used and reveals how the Driscoll MS and Madison HS boundaries relate. - The GIS enables zoom-in to dynamically restructure the view. - Other layers, such as streets and schools, are added to the view. - Geographic object labels (such as school names) can be turned on/off and flexibly viewed. - Patterns of school performance are revealed by use of differently colored markers. 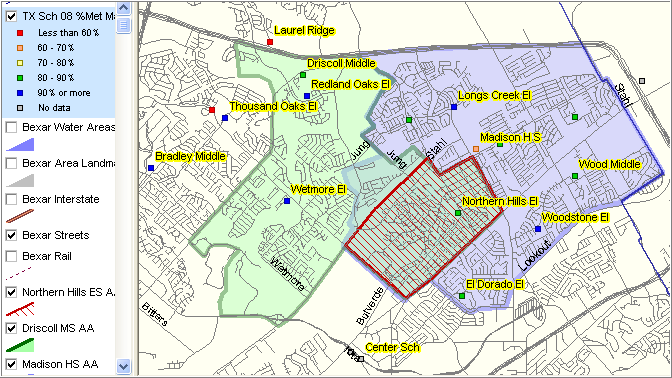
Patterns of economic prosperity (median household income) are shown for the area. - Median household income is shown by census block group (averaging 1,000 people). - The Northern Hills ES AA boundary appears in red. 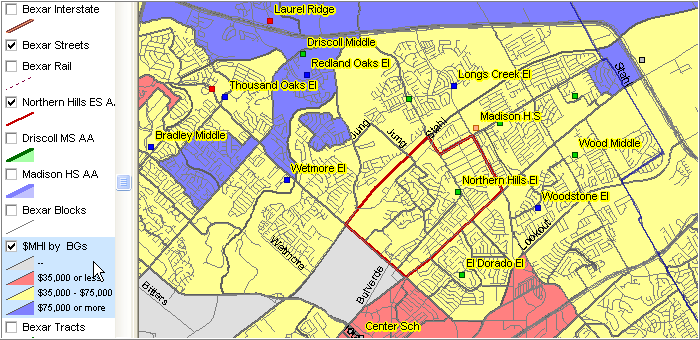
Change since Census 2000 - Number of households change by census tract in Bexar County - North East ISD boundary blue boundary 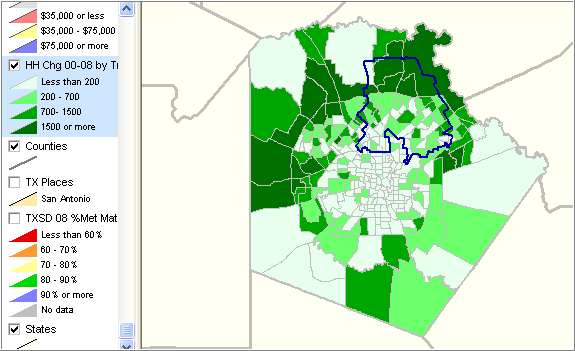
Additional Information Proximity develops geodemographic-economic data and analytical tools and helps organizations knit together and use diverse data in a decision-making and analytical framework. We develop custom demographic/economic estimates and projections, develop geographic and geocoded address files, and assist with impact and geospatial analyses. Wide-ranging organizations use our tools (software, data, methodologies) to analyze their own data integrated with other data. Contact Proximity (888-364-7656) with questions about data covered in this section or to discuss custom estimates, projections or analyses for your areas of interest. |
|
|