|
|
|
Interactive School District Ranking Analysis Texas School Performance Analysis Attendance Zones School District DMI Main Page |
Texas School District Performance Analysis
 Visual Pattern Analysis. Analyze school and school district performance patterns in the context of other subject matter
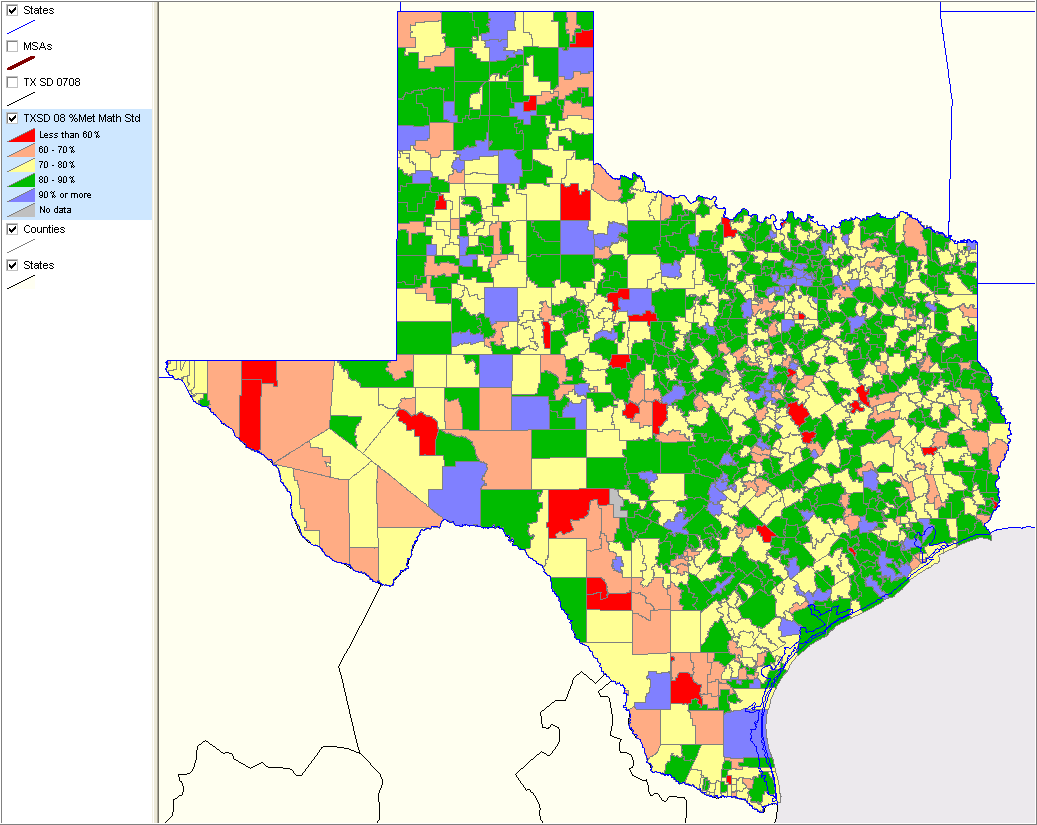
and geography. The map at the right shows patterns of school district performance based on
the percent of students that met the 2008 TAKS math performance standard (all students).
For larger view and color pattern definitions, click on map graphic then press F11 key.
Click here then press F11 key
to see alternative view with zoom-in to the San Antonio MSA/region (bolder brown boundary).
The ready-to-use GIS project enable developing analytical views for many different performance measures.
This map was prepared using CommunityViewer.
The CV GIS project is available to registered users and enables many other related wide-ranging view and analyses.
Integrate your own data.
Visual Pattern Analysis. Analyze school and school district performance patterns in the context of other subject matter
and geography. The map at the right shows patterns of school district performance based on
the percent of students that met the 2008 TAKS math performance standard (all students).
For larger view and color pattern definitions, click on map graphic then press F11 key.
Click here then press F11 key
to see alternative view with zoom-in to the San Antonio MSA/region (bolder brown boundary).
The ready-to-use GIS project enable developing analytical views for many different performance measures.
This map was prepared using CommunityViewer.
The CV GIS project is available to registered users and enables many other related wide-ranging view and analyses.
Integrate your own data.
Texas School District Performance Interactive Ranking Analysis Click column header to sort; click again to sort other direction. See related Ranking Tables Main Page Data source: Texas Education Agency; data analysis, access, tools: Proximity Column headers District Name Code Title1 -- Title I AYP Requirements Comments -- District 2008 AYP Status with Comments Final -- District 2008 AYP Status GrdHi12 -- Highest Grade Offered AYP TAKS Reading RARPR07N -- 2007 Met Performance Standard, All Students, Reading Numerator RARPR07D -- 2007 Number Tested, All Students, Reading Denominator RARPR07R -- 2007 % Met Performance Standard, All Students RARPR08N -- 2008 Met Performance Standard, All Students, Reading Numerator RARPR08D -- 2008 Number Tested, All Students, Reading Denominator RARPR08R -- 2008 % Met Performance Standard, All Students AYP TAKS Math MAMPR07D -- 2007 Met Performance Standard, All Students, Math Numerator MAMPR07N -- 2007 Number Tested, All Students, Math Denominator MAMPR07R -- 2007 % Met Performance Standard, All Students MAMPR08D -- 2008 Met Performance Standard, All Students, Math Numerator MAMPR08N -- 2008 Number Tested, All Students, Math Denominator MAMPR08R -- 2008 % Met Performance Standard, All Students Graduation GAGC406N -- 2006 Completion/Student Status: Graduates, All Students Numerator GA0C406D -- 2006 Completion/Student Status: Number in Class, All Students Denominator GAGC406R -- 2006 Completion/Student Status: Graduation Rate, All Students Rate GAGC407N -- 2007 Completion/Student Status: Graduates, All Students Numerator GA0C407D -- 2007 Completion/Student Status: Number in Class, All Students Denominator GAGC407R -- 2007 Completion/Student Status: Graduation Rate, All Students Rate Districts and District Equivalents Included. Regular foundation school program (FSP) districts and special statutory districts are evaluated for AYP. State-administered school districts are not evaluated for AYP. Beginning in 2005, charter operators are evaluated for AYP based on aggregate results for the campuses operated by the charter. New districts, including new charter districts, are not evaluated for AYP. Districts with no students enrolled in Grades 3–8 and 10 are not evaluated for AYP. There are 1,229 district/district equivalents included in the ranking table. To view only the 1,029 conventional school districts, use the Query on Name and enter the value ISD in the edit box. |
|
|