CV XE GIS Home Page


  ProximityOne Main

  VDA Web GIS

  Situation & Outlook

  Related Sections
  - Applications Gallery
  - States
  - School Districts
  - Metros
  - Congressional
  - Counties
  - Census Tracts
  - Block Groups
  - Census Blocks
  - ZIP Codes
  - Urban Areas

  Estimates-Projections
  - County Interactive
  - 5-year Projections
  - Quarterly Projections
  - 2030 Projections
  - 2060 Projections

  CV XE GIS
    Visual Analysis

  Interactive Tables

  National Scope
  Demographic Change
  2000-2010
  - States
  - Metros
  - Congressional Dist
  - School Districts
  - Counties
  - Cities/Places
  - Census Tracts


Decision-Making Information
  ProximityOne
  information resources & solutions
  (888) DMI-SOLN
  (888) 364-7656


Put data to work more effectively.
Certificate in Data Analytics


Data Analytics Blog
Power of Combining Maps with Data

Support & Technical Assistance
help using these resources


Examining New Authorized Residential Construction
  .. monthly, year-to-date, annual time series data
  .. city, county, metro, state, national
  .. tools & data to examine housing growth; new residential construction

October 2021 .. the number of total housing units changed from 131,704,730 (Census 2010) to 140,498,736 (Census 2020) .. a change of 8.8 million units (6.7%). These and related data are available in seconds using DEDE. Estimates of the number of housing units since Census 2020, and as of July 2021, at the county level will be released as part of the Census Bureau population estimates program in June 2022. These estimates are based in part on new authorized residential construction, building permits, the focus of this section. ProximityOne develops annual housing unit estimates and projections at the county level for the period 2010 through 2025, available now, using a similar methodology as a part of the Situation & Outlook program.

Leading Economic Indicator
New authorized residential construction data are a leading economic indicator. An increase in the number of building permits can signal the start or increase in economic activity. These data are important to businesses, governments, policy-makers and stakeholders - how, where and when is housing changing; how are residential markets changing? Building permits data are tabulated by thousands of cities, counties and metros across the country. Many permit issuing places tabulate these data monthly, others report the data annually. These data can provide a continuous measure of the health of a city, county, region and characteristics of the housing market.

County and Place Time Series Data
The county and place building permits time series database is updated monthly. There is only a one month lag between the data reference date (e.g., August 2021) and the date of availability (e.g., September 2021. Data include the number of units, buildings and valuation for single family, 2-unit, 3-4 unit and 5 or more unit structures. The data are integrated into a database with other wide-ranging data including Census 2010, Census 2020, and annual housing characteristics.

Examining Monthly Building Permits by City/Place
Use the Visual Data Analytics (VDA) Web GIS to develop maps like shown below .. August 2021 building permits for monthly permit issuing places in the Dallas, TX metro. This view shows places with blue boundary labeled with the number of building permits issued in context of the urban areas (salmon fill pattern). The Dallas city area (crosshatched) is clicked and shows a profile for the place in the Profile Panel (lower left). As shown in the profile, and in the map view, there were 136 single family unit permits issued in August 2021.


New Authorized Residential Construction -- tabular view
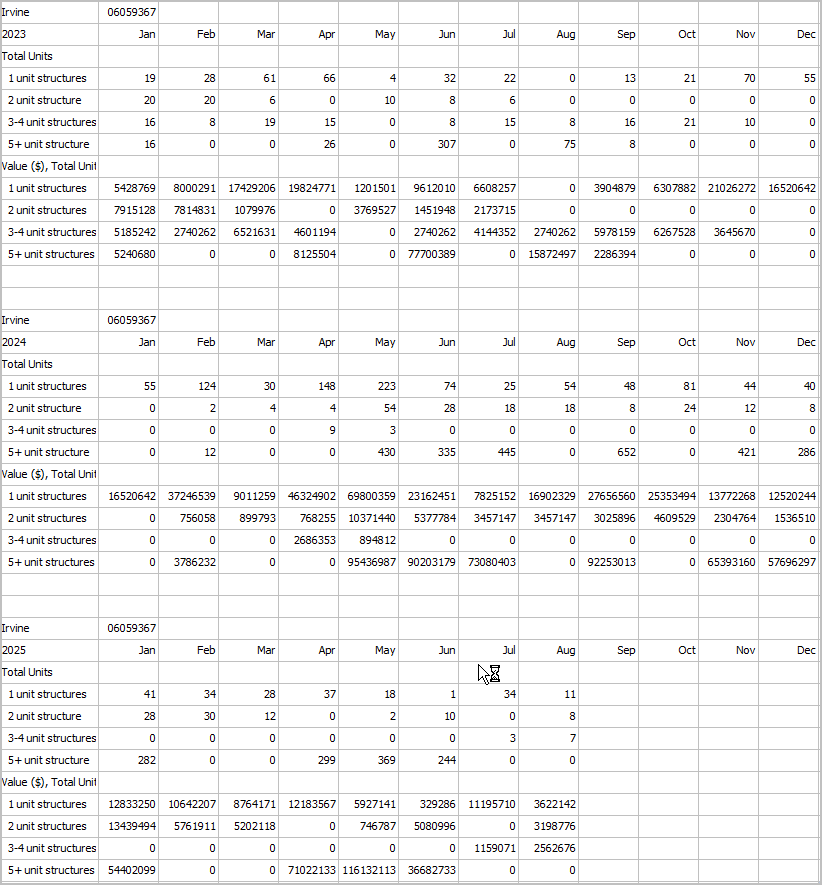
.. updated monthly based on data reported by local governments. Compare monthly data for 2020 through most recent month. The table shown below is an example for Dallas County, TX. To view the most recent data for area(s) of interest use the "Base-Housing Project" available as part of the Visual Data Analytics (VDA) Web GIS. These data are updated/published monthly in context of related demographic-economic data. See entire profile for Dallas County, TX
Units in StructureJan-20Feb-20Mar-20Apr-20May-20Jun-20Jul-20Aug-20Sep-20Oct-20Nov-20Dec-20
Single Family, Buildings 463 525 365 352 283 520 493 443 513 495 519 587
Single Family, Units 463 525 365 352 283 520 493 443 513 495 519 587
Single Family, Value 118,102 146,435 120,288 103,208 81,065 134,609 132,562 115,890 127,874 136,346 131,877 150,474
2 Unit, Buildings 14 10 8 14 3 13 5 5 8 4 5 4
2 Unit, Units 28 20 16 28 6 26 10 10 16 8 10 8
2 Unit, Value 350 817 2,359 3,458 741 3,271 1,235 1,235 3,485 1,453 1,388 988
3-4 Unit, Buildings 4 1 0 0 0 4 4 1 3 1 1 2
3-4 Unit, Units 16 4 0 0 0 16 12 4 12 4 4 8
3-4 Unit, Value 2,744 665 0 0 0 2,733 1,724 523 1,570 523 523 1,674
5+ Unit, Buildings 15 9 6 10 10 15 7 0 5 4 8 10
5+ Unit, Units 577 80 296 354 1,201 478 50 0 316 239 557 444
5+ Unit, Value 68,926 9,413 31,921 43,677 177,570 44,423 14,818 0 33,095 32,836 66,761 40,594

Units in StructureJan-21Feb-21Mar-21Apr-21May-21Jun-21Jul-21Aug-21Sep-21Oct-21Nov-21Dec-21
Single Family, Buildings 688 539 851 582 794 680 0 0 0 0 0 0
Single Family, Units 688 539 851 582 794 680 0 0 0 0 0 0
Single Family, Value 183,687 137,322 212,222 144,612 192,088 161,211 0 0 0 0 0 0
2 Unit, Buildings 8 4 12 7 8 12 0 0 0 0 0 0
2 Unit, Units 16 8 24 14 16 24 0 0 0 0 0 0
2 Unit, Value 1,976 988 4,453 1,274 2,055 2,483 0 0 0 0 0 0
3-4 Unit, Buildings 0 3 3 2 0 3 0 0 0 0 0 0
3-4 Unit, Units 0 11 10 7 0 9 0 0 0 0 0 0
3-4 Unit, Value 0 2,345 2,413 1,078 0 1,386 0 0 0 0 0 0
5+ Unit, Buildings 26 12 17 8 12 16 0 0 0 0 0 0
5+ Unit, Units 2,138 762 732 299 789 794 0 0 0 0 0 0
5+ Unit, Value 266,789 23,549 79,210 33,739 103,567 91,710 0 0 0 0 0 0

Join us in the weekly VDA Web GIS training and support sessions (every Thursday 3:00 pm ET). Learn about using the housing related data and a wider array of demographic-economic data for many types of geography.

Examining Change in New Authorized Residential Housing Units
Build/use maps and interactive tables using the Visual Data Analytics (VDA) Web GIS. The graphic presented below illustrates use of VDA to examine annual new authorized residential construction (total units) for each year 2016 through 2020 by county for Texas. See more about using VDA to develop this interactive table with associated
.
Insights: in this state you can see the total units authorized time series sorted on 2020 units.
  clicking the Dallas county area in the map view, the profile panel populates for that area.
  see that the 2020 units (units20) shows the same value as in the table.
  optionally copy to clipboard the profile for further analysis.

Support Using these Resources [goto top]
Learn more about demographic economic data and related analytical tools. Join us in a Data Analytics Lab session. There is no fee for these Web sessions. Each informal session is focused on a specific topic. The open structure also provides for Q&A and discussion of application issues of interest to participants.

ProximityOne User Group [goto top]
Join the ProximityOne User Group to keep up-to-date with new developments relating to geographic-demographic-economic decision-making information resources. Receive updates and access to tools and resources available only to members. Use this form to join the User Group.

Additional Information
ProximityOne develops geodemographic-economic data and analytical tools and helps organizations knit together and use diverse data in a decision-making and analytical framework. We develop custom demographic/economic estimates and projections, develop geographic and geocoded address files, and assist with impact and geospatial analyses. Wide-ranging organizations use our tools (software, data, methodologies) to analyze their own data integrated with other data. Follow ProximityOne on Twitter at www.twitter.com/proximityone. Contact us (888-364-7656) with questions about data covered in this section or to discuss custom estimates, projections or analyses for your areas of interest.


Copyright © . ProximityOne. All Rights Reserved.
Sitemap | Contact Us | News