
|
|
|
-- School District Revenue & Expenditure Patterns, FY 2017 April 2020 .. 13,311 regular public school districts reported FY 2017 total revenues of $679,925 billion derived from $51,212 billion federal (7.5%), $317,434 billion state (46.7%) and $311,278 billion local (45.8%) sources. These data are based on the school district finances (F-33) program data released by the Census Bureau in May 2019. States and individual school districts vary widely on the make-up/distribution of these federal, state and local sources. Use tools and data reviewed in this section to examine K-12 school district finances -- sources and uses of funds for FY 2017. View, sort, query, compare school district sources and uses of funds using the interactive table below in this section. Create/view profiles for district(s) of interest. This section updates in early May 2020 with new FY 2018 sources and uses of funds data and related school/school district financial data. We examine the implications of COVID-19 for school systems as we look to Restarting the Economy. Join the User Group to receive updates. Percent Federal Revenue by School District, FY 2017 The following graphic shows patterns of percent Federal revenue by school district (unified and secondary), FY 2017. Click graphic for larger view. Expand browser to full window for best quality view.  - view developed using the ProximityOne CV XE GIS software and related GIS project/files. - use these tools on your computer to examine these data & related geography/subject matter. Percent State Revenue by School District, FY 2017 The following graphic shows patterns of percent State revenue by school district (unified and secondary), FY 2017. Click graphic for larger view. Expand browser to full window for best quality view.  - view developed using the ProximityOne CV XE GIS software and related GIS project/files. - use these tools on your computer to examine these data & related geography/subject matter. Interactive Table Use the interactive table below to examine characteristics of individual school districts in context of U.S. overall, states or metros. Select by state or metro and rank based on any of several selected revenue by source and per student expenditure by category. School District Revenue & Expenditure Patterns; FY 2017 -- Interactive Table .. go top Use mouse-over on header column to view extended item/column name. Click ShowAll button between Find/Queries. See usage notes below table. Related ranking tables: interactive tables. Usage Notes If table returns empty after using an operator below table, Click ShowAll button and repeat operation. Data shown in the table above were developed by merging the Census-sourced "F-33" FY 2017 data with the Census-sourced 2017-18 school year school district boundary file using the Federal school district code. There is not a 1-to-1 match between these files/codes. Where total revenue shows as 0 (228 districts) the F-33 financial data are not available. Table operation details: • Click ShowAll button between queries • Click on a column header to sort on that column; click column header again to sort in other direction. • Click ShowAll button to show all tabulation areas and restore full set of data view. • Click State to select on geographies in a selected state. • Find in Name: Key in text/area name (partial okay) in text box to right of Find-in-Name button. .. then click Find-in-Name button to locate all matches in District column (case sensitive). • Find CBSA: Key in 5-character CBSA code in text box to right of Find CBSA. .. then click Find CBSA button to locate all matches in based on CBSA column. .. CBSA: Core-Based Statistical Area (metro). • RevCols1: Click this button to view only revenue columns. • %RevCols: Click this button to view only revenue columns; revenues expressed as %. • PerStd: Click this button to view only per student columns. • Enrl Min-Max: Key in minimum enrollment in left text box, maximum enrollment in right text box. .. then click Enrl Min-Max button; table refreshes showing only districts within specified range. .. example: note that 500000 min and 1000000 max values show only two districts. • Click ShowAll button between queries View Districts in a Selected Metro To view all school districts in the Dallas, TX MSA (for example) proceed as follows: View list of metro/CBSA names and codes • Click ShowAll button. • Key in the text Dallas in the Find in Name text box and click the Find in Name button. • Visually locate the Dallas ISD row and see that the CBSA code is 19100. • Key in the text 19100 in the Find in CBSA text box. • Click ShowAll button. • Click the Find in CBSA button. • All districts in the Dallas MSA now appear; rank on any column. Column Headers & Item Descriptions - scroll section
View/Analyze Data for Selected District(s) (step-by-step Windows instructions) Click a district of interest in the table (see usage notes below table). .. the row turns blue .. right click the row and select "Copy" Open the SDFA XLS shell .. this operation requires Excel to be operating on your computer. .. click the above link; the table shell opens in the default XLS file handler .. as Excel opens, you might have to authorize "Enable Editing" (an Excel feature). .. paste into cell C1 (where text says "1 paste here then copy" .. copy the pasted group of cells (right-click C1 and select Copy) .. paste special transpose into cell C2 (where it says "2 copy above selected and 'paste special transpose' here" ) ... right-click C2, select Paste Special, then choose Transpose, then OK Done. Illustrative comparative analysis profile for two districts .. graphic shows partial view .. open full xls profile 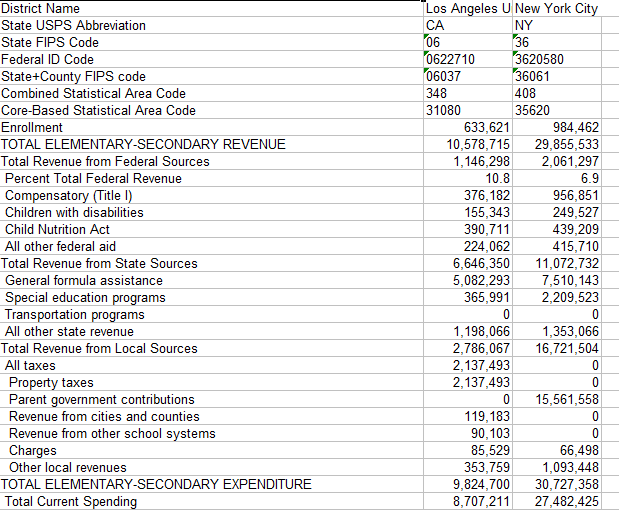 Scope of Data Data are based on an annual survey of public elementary and secondary education systems, mostly school districts, conducted by the Census Bureau under sponsorship of the U.S. Department of Education. Enrollment. Enrollment data are based on data reported by school districts and state education agencies for the 2015-16 school year. Enrollments for state educational facilities, federal school systems and charter schools whose charters are held by a nongovernmental entity have been excluded (treated as zero). In an effort to have these data for regular school districts only, public school systems with zero enrollment reported are not included in the interactive table. Total revenue data are shown in the ranking table in thousands of dollars. Financial data are shown on cash basis. In many cases financial data will differ from financial data reported by school districts due to wide-ranging different accounting procedures used district to district. Data shown in the ranking table use standardized accounting categories across all districts except as noted in supplemental notes (not shown in this section). • List of items used in comparative analysis profile • List of extended database items • Terms and Glossary Limitations of Data These data are reported by school districts. They are not estimates subject to estimation error. However, financial data reporting and categorization differs from state to state. As a result, some data cells show as zero while in fact the data for that cell is included in another category, such as "Other." Charter Schools Many states have passed legislation authorizing the formation of charter schools. While each state's charter school provisions are unique, there are some common characteristics. In general, a charter constitutes a contract between a governmental body (the governmental body would be considered the chartering or sponsoring entity) and an operator entity that is responsible for delivering the education services. Finance data covered in this program, as collected by the Census Bureau, only charter schools whose charters are held by operators that are governmental bodies are considered to be in scope. For example, if a city or county obtains a charter to operate a school from a sponsoring local school district, the finances of the resulting charter school are included in Census Bureau education finance statistics (and thus are included in the summary tables and data files). The finances for these charter schools are often included within the finances of the sponsoring school district. Charter schools whose charters are held by operators that are not governmental are considered to be out of scope for the purposes of Census Bureau government finance statistics. In these cases, school district payments to charter schools are included (within the expenditures of the paying school district), but the finances of the charter schools themselves are excluded from the statistics (and thus are excluded from the data covered in this section). Support Using these Resources Learn more about accessing and using demographic-economic data and related analytical tools. Join us in a Data Analytics Lab session. There is no fee for these one-hour Web sessions. Each informal session is focused on a specific topic. The open structure also provides for Q&A and discussion of application issues of interest to participants. ProximityOne User Group Join the ProximityOne User Group to keep up-to-date with new developments relating to metros and component geography decision-making information resources. Receive updates and access to tools and resources available only to members. Use this form to join the User Group. Additional Information ProximityOne develops geodemographic-economic data and analytical tools and helps organizations knit together and use diverse data in a decision-making and analytical framework. We develop custom demographic/economic estimates and projections, develop geographic and geocoded address files, and assist with impact and geospatial analyses. Wide-ranging organizations use our tools (software, data, methodologies) to analyze their own data integrated with other data. Follow ProximityOne on Twitter at www.twitter.com/proximityone. Contact us (888-364-7656) with questions about data covered in this section or to discuss custom estimates, projections or analyses for your areas of interest. |
|
|