|
|
|
U.S. by County Interactive Ranking Table |
Health Insurance Coverage Patterns
The Census Bureau estimates are for the population as of 2006 and their insurance coverage as of 2005. The estimates cover all states and counties across gender, age and income as well as race and Hispanic origin. Many more detailed items are only summarized at the state level.  The map at right shows percent uninsured population under 65 years of age.
Red counties have 20 percent uninsured or more.
Blue counties have less than 20 percent uninsured.
This map was prepared using CommunityViewer.
The CV GIS project enables many other related wide-ranging views and enables users to integrate their own data.
The map at right shows percent uninsured population under 65 years of age.
Red counties have 20 percent uninsured or more.
Blue counties have less than 20 percent uninsured.
This map was prepared using CommunityViewer.
The CV GIS project enables many other related wide-ranging views and enables users to integrate their own data.
The estimates are partly funded by the Centers for Disease Control and Prevention in support of its National Breast and Cervical Cancer Early Detection Program. The program provides free cancer screenings to low-income, uninsured women. and seeks to use the data to more effectively gauge the level of need for breast and cervical cancer screening across the country, Health Insurance Coverage Interactive Ranking Table Click column header to sort; click again to sort other direction. See related Ranking Tables Main Page Data from Census Bureau; presentation and analyses by Proximity. Ranking Table Column Descriptions 1 - County Name 2 - State -- State postal abbreviation 3 - StCty -- State+County FIPS code 4 - TotPop -- Total population, 7/1/2006 5 - Pop<65 -- Population under 65 years, 7/1/2006 6 - %Pop<65 -- Percent 6) of 5) 7 - Ins<65 -- Insured population under 65 years, 7/1/2006 (based on coverage in 2005) 8 - Ins<65moe -- 7) margin of error 9 - Unins<65 -- Uninsured population under 65 years, 7/1/2006 (based on coverage in 2005) 10 - Unins<65moe -- 9) margin of error 11 - %Unins<65 -- Percent uninsured population under 65 years, 7/1/2006 (based on coverage in 2005) 12 - %Unins<65moe -- 11) margin of error Related Notes. There are no estimates of the insured or uninsured total population. The population under 65 years of age is the closest population group to the total population as available. Similarly, though other age breakouts exist, there are no estimates available, at this time, for the population under 18 years, ages 0 to 4 years, or ages 5 to 17 years. Analyzing Regions by County Coverage. Use the same map project described above to zoom into regions of interest. Add other types of geography as layers. Integrate other subject matter. The following map view shows patterns similar to those described above but for the Houston, TX MSA (MSAs are depicted with the bolder brown boundary). Click on the graphic, then press F11 key, to view an extended from Dallas to San Antonio to Houston. 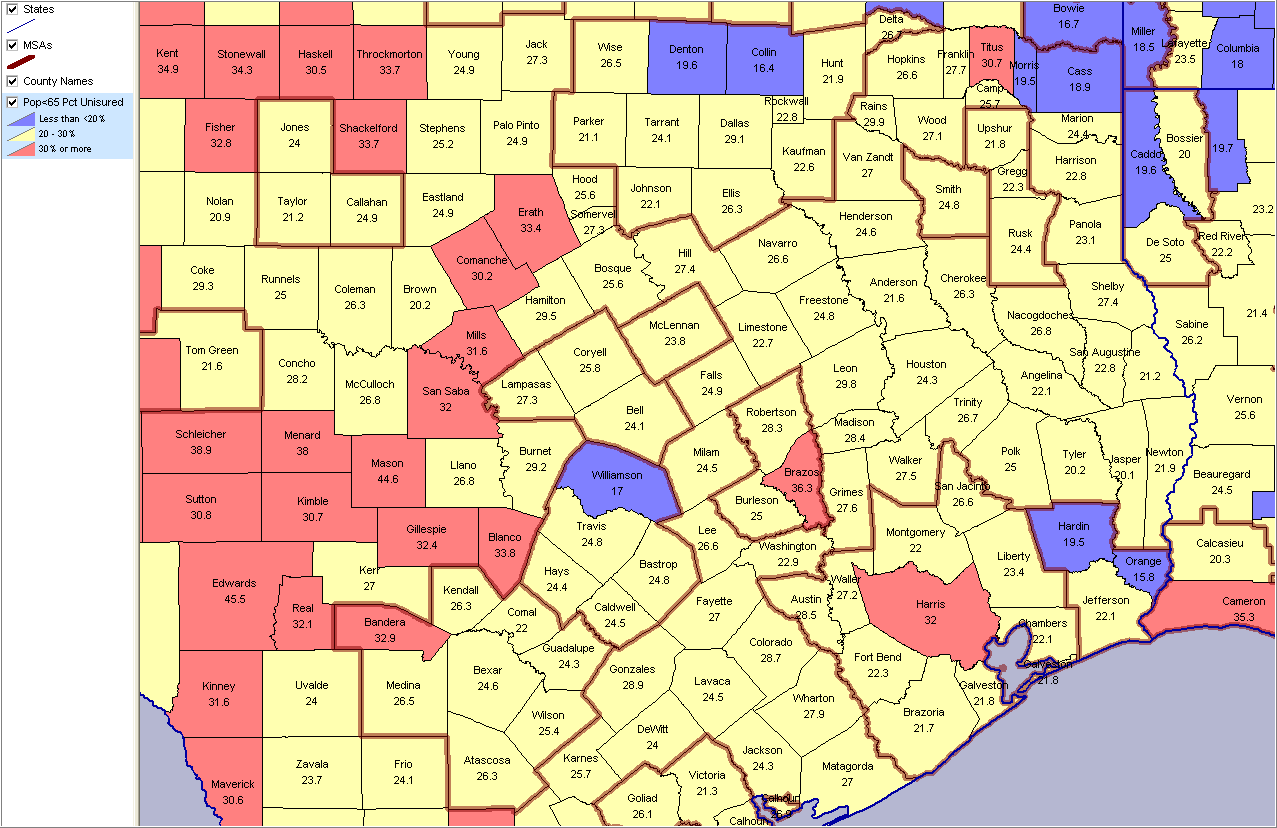
Additional Information. Register using this form for information on special reports and detailed research-oriented data relating to health analyses (note special interest health in text section). |
|
|