
|
|
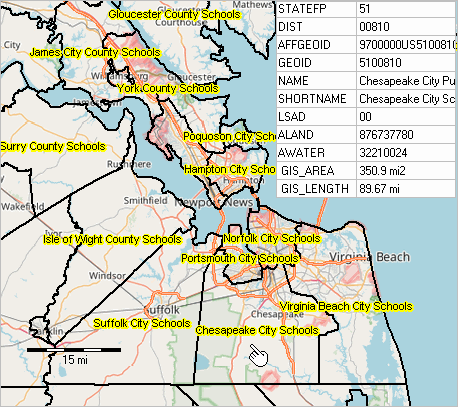
January 2019. The largest school districts are in Alaska. The largest district, North Slope Borough, AK, is almost 95,000 square miles (land+water) and 88,700 square miles based on land area only. This district would be almost 310 by 310 miles structured as a square. The geographic size has been computed for 13,309 school districts based on boundaries reported as of January 2018. Use the interactive table below to view, compare, rank school district geographic size based on land area, water area or combined land and water area. The average size of unified school districts (type U in table) included in the table is 248.7 SqMi. The average size of school districts by state ranges widely as a result of Hawaii being one school district, Alaska being a few school districts and some states where school districts are coterminous with counties. Using GIS Tools to Dynamically Examine Geographic Size/Attributes The following graphic shows school districts in the Virginia Beach-Norfolk-Newport News, VA-NC MSA (see Situation & Outlook report). Using GIS tools, the select/identify feature is used to click on the Chesapeake City Schools, VA school district (see pointer) to display a mini-profile, shown in upper right of the graphic. The geographic area and perimeter length are computed dynamically and displayed in the profile. This is a useful feature to easily compare any set of geographic areas, in a more analytical context.  - View developed using CV XE GIS and related GIS project. History and Updating of School District Geography/Boundary Files The first U.S. national scope school district boundary files and state-by-state school district maps were developed by Warren Glimpse, founder of ProximityOne in the 1990s, as a part of the first School District Special Tabulation (SDST). The SDST is a children's demographic database first developed based on the 1990 census, now updated annually based on the American Community Survey. School ACS 2017 district boundary files, shapefiles, are now updated every two years as a part of the Census TIGER digital map database. School District by Geographic Size Interactive Table Click ShowAll button below table between queries. Click column header to sort; click again to sort other direction. See related interactive tables. • Click on a column header to sort on that column; click column header again to sort in other direction. • Click ShowAll button to show all areas and restore full set of data view. • Click State to view districts in a selected state (click ShowAll between selections). • Find by Name: key in partial area name in text box to right of Find Name> button then click button to locate all matches (case sensitive). • See related tables. • Obtain CBSA/Metro code from this table -- full 5-character numeric code in column 3. • Obtain State/County code from this text file -- full 5-character numeric code in column 3. Related Sections • School District ACS 2017 Demographic-Economic Characteristics .. 4 sections/files .. General Demographics .. Social .. Economic .. Housing • School District 2010-2017 Annual Demographic Estimates .. 2018 annual updates; all school districts .. total population, school age population, school age population in poverty • Children's Demographic & K-12 Schools Main Support Using these Resources Participate in weekly Data Analytics Lab sessions to learn about accessing and using these and related data. Topics covered include: - questions that you have. - navigation through use of program resources. - using your data with these resources. - developing and using projections with these resources. There is no fee for these one-hour Web sessions. Each informal session is structured around selected topics. The open structure provides for Q&A and discussion of application issues of interest. Additional Information ProximityOne develops geodemographic-economic data and analytical tools and helps organizations knit together and use diverse data in a decision-making and analytical framework. We develop custom demographic/economic estimates and projections, develop geographic and geocoded address files, and assist with impact and geospatial analyses. Wide-ranging organizations use our tools (software, data, methodologies) to analyze their own data integrated with other data. Follow ProximityOne on Twitter at www.twitter.com/proximityone. Contact us (888-364-7656) with questions about data covered in this section or to discuss custom estimates, projections or analyses for your areas of interest. |
|
|