
|
|
|
In the 2015-16 school year, there were 21 school districts in Texas (of a total 1.025) with enrollment of 50,000 or more students. Among these districts, six districts experienced an enrollment decline between the 2011-12 and 2015-16 school years. Four districts experienced more than 10-percent increase in enrollment (Frisco, Katy, Conroe and Klein). Use the interactive table below to view, rank, query and compare Texas school districts by annual enrollment, 2011-12 to 2015-16, and change over the period. This section provides access to data analytics tools to examine patterns and characteristics of enrollment for Texas local education agencies. Use the GIS project and datasets described here to examine districts and regions of interest. Patterns of Enrollment Change: Texas School Districts. 2011-2015 The following graphic shows patterns of the percent enrollment change by Texas school district during the period 2011-12 to 2015-16 school year. The percent change intervals/colors as depicted in legend panel at left of map window. Create custom maps similar to this view for your regions of interest. Examine alternative patterns such as percent change for different time periods, enrollment change or enrollment level. Set queries to include school district by peer group. Click graphic for larger view with more detail; expand browser window for best quality view. 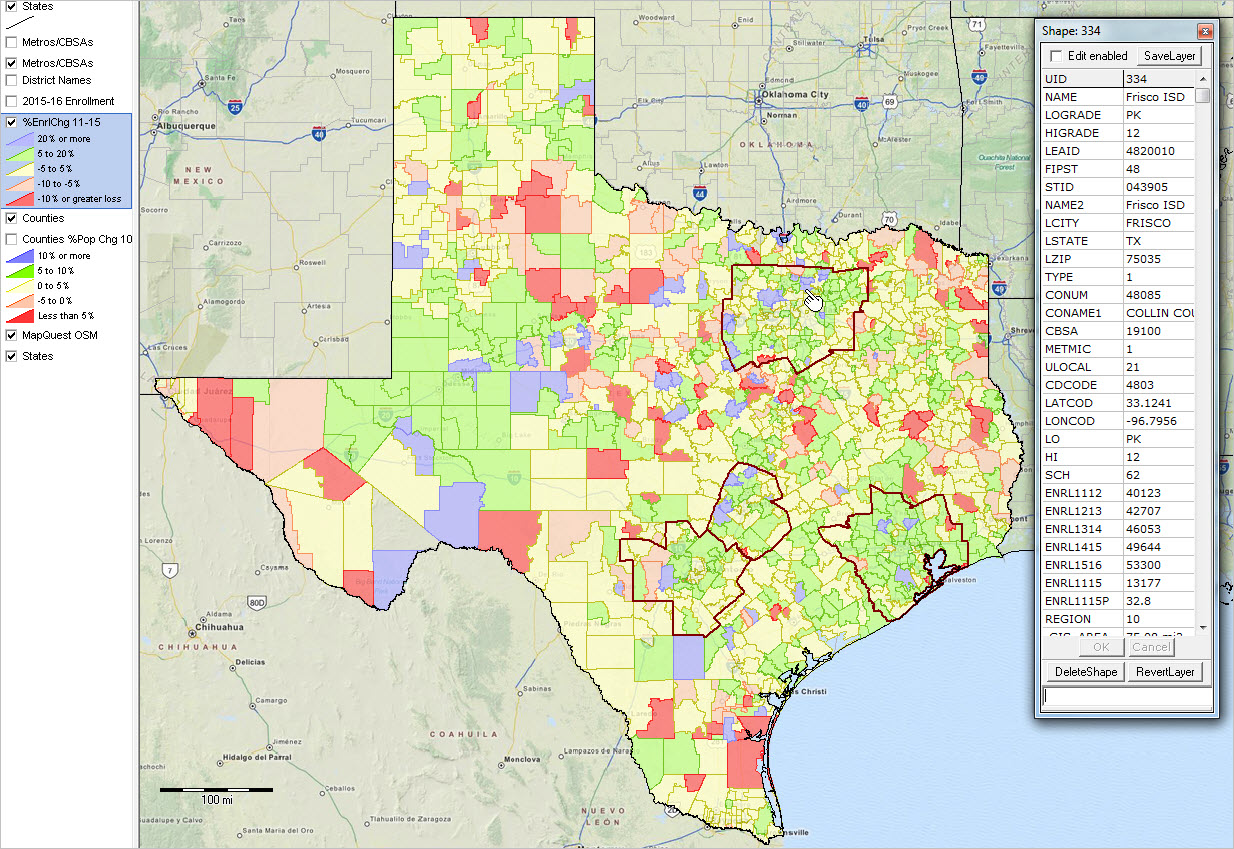 View developed with CV XE GIS software using the Texas school districts GIS project. Use this GIS Project/Datasets on Your Computer View maps for your areas of interest. Add other geography/subject matter. Modify content, color settings, labeling and other attributes. See details about installing and getting started below in this section. The following views (click link) show a zoom-in with districts labeled with name and 2015-16 enrollment. .. Install the software and GIS project on your Windows computer for alternative and more detailed views. • Dallas Metro Region • Dallas Metro Region - Toyota/Plano (shows Plano city) .. illustrates addition of a marker showing location of North American Toyota Headquarters & view of Plano city boundary .. use txsd2016plano.gis project to see this view. • Houston Metro Region • Houston Metro Region - Exxon/Woodlands (shows Woodlands/Spring cities) .. illustrates addition of a marker showing location of Exxon Headquarters & view of The Woodlands & Spring city boundaries .. use txsd2016woodlands.gis project to see this view. • San Antonio-Austin Metro Region Join us in a Data Analytics Lab session (weekly Tuesdays) to learn more about creating variations of these views -- that you can develop on a Windows computer. There is no fee for these Web sessions. School Districts by Locale Code The following view shows patterns of school districts by locale code. Examine districts based locale code in the interactive table below. See more about locale code below in this section. 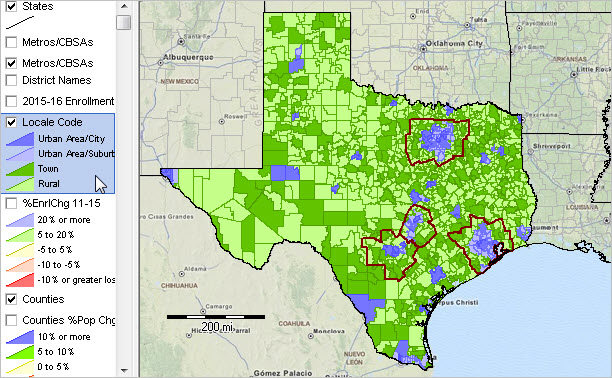 View developed with CV XE GIS software using the Texas school districts project. Additional School District Demographic-Economic Data Interactive tables; view attributes of individual school districts in context of others. -- national scope tables; select only Texas (or other state) using tools below table on respective pages. -- compare Texas (or other state) school districts by national scope peer group size. • General Demographics • Social Characteristics • Economic Characteristics • Housing Characteristics More about data analytics and analyzing the school district community. Enrollment by Texas Local Education Agency: 2011-12 - 2015-16 Interactive Table Click ShowAll button between Find/Queries. Click column header cell to sort table on that column; click again to sort other direction. Use mouseover on column header to view column description. See usage notes below table. See demographic-economic interactive tables. Usage Notes LEA: Local Education Agency TEA: Texas Education Agency Operations: • Click ShowAll between queries/filters. • Click a column header to sort on that column; click again to sort other direction. • Find-in-Name button .. enter a partial case-sensitive LEA name in the edit box to right of Find-in-Name button. .. click to Find-in-Name button to show only rows with that text in the LEA name (column 1). • FindCBSA button .. enter an exact 5-character CBSA code in the edit box to right of FindCBSA button. .. click to FindCBSA button to show only rows with that text in the CBSA code (column 4). .. the default code 26420 is the Houston CBSA code. • Enrollment 2015-16 Min & Max> button .. click to show only peer group LEAs based on enrollment .. the ShowAll button must be clicked before using this feature. .. in min and max edit boxes ... ... enter the minimum 2015-16 enrollment in the left edit box. ... enter the maximum 2015-16 enrollment in the right edit box. .. click 2015-16 Enrl Min & Max button to view LEAs in group. • Click ShowAll between queries/filters. Items in Table - Name -- LEA Name - City - Zip - ID1 -- Texas/TEA LEA code - ID2 -- NCES LEA code - Rgn -- Texas/TEA Region code - Cty -- County state/county FIPS code - CtyName -- County name - CBSA -- Metro/Core-Based Statistical Area code - Type -- LEA Type: 1-school district, 2-charter - Met -- Type of metro - Locale -- Locale code - CD -- Congressional district code - GrLo -- Low grade - GrHi -- High grade - Schools -- number of schools (CCD 12-13) - Enrollment 2011-12 -- from TEA - Enrollment 2012-13 -- from TEA - Enrollment 2013-14 -- from TEA - Enrollment 2014-15 -- from TEA - Enrollment 2015-16 -- from TEA - Change 2011-2015 - %Change 2011-2015 Locale Code Assigned by NCES/U.S. Department of Education. 11 = City, Large Territory inside urbanized area and inside a principal city with population of 250,000 or more. 12 = City, Mid-size Territory inside urbanized area and inside a principal city with population < 250,000 and >= 100,000. 13 = City, Small Territory inside urbanized area and inside a principal city with population less than 100,000. 21 = Suburb, Large Territory outside a principal city and inside urbanized area with population of 250,000 or more. 22 = Suburb, Mid-size Territory outside a principal city and inside urbanized area with a population < 250,000 and >= 100,000. 23 = Suburb, Small Territory outside a principal city and inside an urbanized area with a population less than 100,000. 31 = Town, Fringe Territory inside an urban cluster that is less than or equal to 10 miles from urbanized area. 32 = Town, Distant Territory inside an urban cluster that is > 10 miles and <= 35 miles from urbanized area. 33 = Town, Remote Territory inside an urban cluster that is more than 35 miles from urbanized area. 41 = Rural, Fringe rural territory that is <= 5 miles from UA and <= 2.5 miles from UC. 42 = Rural, Distant rural territory that is > 5 miles but <= 25 miles from UA and > 2.5 miles but <= 10 miles from UC. 43 = Rural, Remote rural territory that is > 25 miles from UA and > 10 miles from UC. GIS Project & Datasets -- Creating Map Pattern Views & Visual Analysis 1. Install the ProximityOne CV XE GIS ... run the CV XE GIS installer ... take all defaults during installation 2. Download the Texas School Districts GIS project fileset ... requires ProximityOne User Group ID (join now) ... unzip GIS project files to local folder c:\txsd 3. Open the GIS project ... after completing the above steps, click File>Open>Dialog ... open the file named c:\txsd\tx_sd_2016.gis 4. Done. The start-up view is similar to the graphic shown at the top of this section. 5. Additional items included in the zip file: ... open/use the supplemental GIS project file focused on north Dallas area -- c:\txsd\txsd2016plano.gis ... open/use the supplemental GIS project file focused on north Houston area -- c:\txsd\txsd2016woodlands.gis ... these project use the all Texas all city boundary shapefile ... and illustration marker point shapefiles (for Toyota and Exxon headquarters) ... see above map links to preview use of these projects and shapefiles. Join us in a Data Analytics Lab session (weekly Tuesdays) to learn more about creating variations of these views -- that you can develop on a Windows computer. There is no fee for these Web sessions. Terms of Use These data are authorized for personal, non-business, use and may not be redistributed nor used to provide professional advice. There is no warranty of any type associated with any aspect of these data. The user is solely responsible to any use, direct or indirect, that might be made of the data. Support Using these Resources Learn more about demographic economic data and related analytical tools. Join us in the Data Analytics Lab sessions. There is no fee for these Web sessions. Each informal session is focused on a specific topic. The open structure also provides for Q&A and discussion of application issues of interest to participants. ProximityOne User Group Join the ProximityOne User Group to keep up-to-date with new developments relating to geographic-demographic-economic decision-making information resources. Receive updates and access to tools and resources available only to members. Use this form to join the User Group. Additional Information ProximityOne develops geographic-demographic-economic data and analytical tools and helps organizations knit together and use diverse data in a decision-making and analytical framework. We develop custom demographic/economic estimates and projections, develop geographic and geocoded address files, and assist with impact and geospatial analyses. Wide-ranging organizations use our software, data and methodologies to analyze their own data integrated with other data. Follow ProximityOne on Twitter at www.twitter.com/proximityone. Contact ProximityOne (888-364-7656) with questions about data covered in this section or to discuss custom estimates, projections or analyses for your areas of interest. |
|
|