
|
|
ProximityOne Main School Districts Main Geospatial Analytics VDA Web GIS VDA Desktop GIS DEDE Data Access Related Sections - States - School Districts - Metros - Congressional District - Counties - Tracts/Neighborhoods - Block Groups - Census Blocks - ZIP Codes - Urban Areas Estimates-Projections |
School District Community ... assessing trends & patterns: forming visions of & for the future
The "school district community" shares the same geographic boundary as the school district. Yet, the school district community is broader than the schools, students and educational infrastructure. It is comprised of the total population living within the school district. The school district community includes all of the housing, transportation facilities, security, recreational resources, and businesses within the school district boundaries. The geography of the school district is often different than the related city or county. See more below about sources and integrating data resources to examine the school district community. Examining the School District Community Using VDA Web GIS The following graphic illustrates use of the Visual Data Analytics (VDA) Web GIS with the K-12 Schools & School Districts project. Use VDA Web GIS with only a web browser to create and examine views/data like this for any area in the U.S. Start VDA Web GIS now. Open the K12 Schools & School Districts project to see this view and do more. More about VDA GIS. More about Geographic Information Systems (GIS). This view shows four elementary school districts (orange boundary) that are nested within one secondary school district (green boundary) located in the Huntington Beach area of Orange County, CA. Schools are shown as markers. Click the graphic for a larger view that also shows the legend panel. The larger views shows patterns of economic prosperity (median household income by census tract). It is now possible to see how schools and school districts relate to neighborhoods - one aspect of the school district community.  How School Districts relate to Cities/Places .. goto top By turning on and modifying the cities/places layer, the relationship between the cities and school districts is better understood; the school district community. 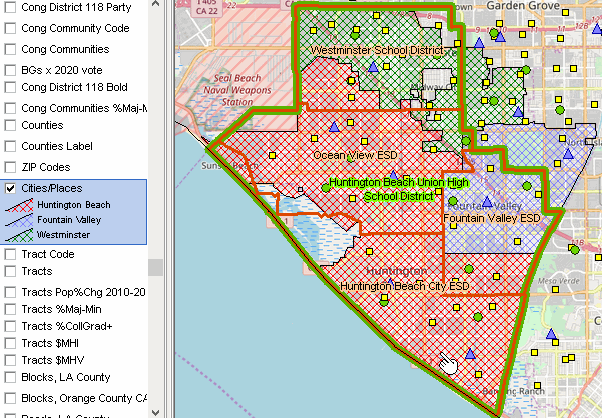 How School Districts relate to Congressional Districts .. goto top The relationship between school districts and congressional districts (CD) is illustrated in the graphic below. The bold brown CD 45/47 boundary cuts through HBUHSD and related ESDs except for HB City ESD.  Data Resources & Integration .. goto top Boundary Files and Geographic Data - boundary files - school district size http://proximityone.com/schooldistrict_size.htm - schoool attendance zones http://proximityone.com/saz.htm - equivalence files - school district to county Census 2020 Demographic Data http://proximityone.com/schooldistrict_demographics.htm ACS Demographic-Economic Data ACS School District Special Tabulation http://proximityone.com/sdst2021.htm Common Core of Data School & School District Data Public Schools Data Private Schools Data School District Finances -- Sources and Uses of Funds Data Item Summary Table Number, Column Description F33 21 Identification Number1 F33 21 School System Name1 F33 21 ANSI State and County Code1 F33 21 Consolidated Statistical Area1 F33 21 Core-Based Statistical Area1 F33 21 NCES Identification Number1 F33 21 Fall enrollment F33 21 TOTAL ELEMENTARY-SECONDARY REVENUE F33 21 Total Revenue from Federal Sources F33 21 Compensatory (Title I) F33 21 Children with disabilities F33 21 Child Nutrition Act F33 21 All other federal aid F33 21 Total Revenue from State Sources F33 21 General formula assistance F33 21 Special education programs F33 21 Transportation programs F33 21 All other state revenue F33 21 Total Revenue from Local Sources F33 21 All taxes F33 21 Property taxes F33 21 Parent government contributions F33 21 Revenue from cities and counties F33 21 Revenue from other school systems F33 21 Charges F33 21 Other local revenues F33 21 TOTAL ELEMENTARY-SECONDARY EXPENDITURE F33 21 Total Current Spending F33 21 Total salaries and wages F33 21 Total employee benefit payments F33 21 Total Current Spending for Instruction F33 21 Salaries and wages for instruction F33 21 Employee benefits for instruction F33 21 Total Current Spending for Support Services F33 21 Pupil support F33 21 Instructional staff support F33 21 General administration F33 21 School administration F33 21 Other and nonspecified F33 21 Other Current Spending F33 21 Total Capital Outlay Expenditure F33 21 Payments to Other Governments F33 21 Interest on School System Indebtedness F33 21 Long-term debt outstanding at end of the fiscal year F33 21 Long-term debt issued during the fiscal year F33 21 Long-term debt retired during the fiscal year F33 21 PERCENT - TOTAL ELEMENTARY-SECONDARY REVENUE F33 21 Percent - Total Revenue from Federal Sources F33 21 Percent - Compensatory (Title I) F33 21 Percent - Total Revenue from State Sources F33 21 Percent - General formula assistance F33 21 Percent - Total Revenue from Local Sources F33 21 Percent - Taxes and parent government contributions F33 21 Percent - Revenue from other local governments F33 21 Percent - Charges F33 21 PER PUPIL - TOTAL CURRENT SPENDING (ELEMENTARY-SECONDARY)1 F33 21 Per Pupil - Total salaries and wages F33 21 Per Pupil - Total employee benefit payments F33 21 Per Pupil - Total Current Spending for Instruction F33 21 Per Pupil - Salaries and wages F33 21 Per Pupil - Employee benefits F33 21 Per Pupil - Total Current Spending for Support Services F33 21 Per Pupil - Pupil support F33 21 Per Pupil - Instructional staff support F33 21 Per Pupil - General administration F33 21 Per Pupil - School administration Small Area Income and Poverty programs estimates (SAIPE) - school district poverty for children ages 5 to 17 in families estimates - for use in Title I formula/allocation ProximityOne User Group Join the ProximityOne User Group to keep up-to-date with new developments relating to geographic, demographic, economic and business data. Receive updates and access to tools and resources available only to members. Use this form to join the User Group. Support Using these Resources Learn more about accessing and using demographic-economic data and related analytical tools. Join us in a Data Analytics Lab session. There is no fee for these one-hour Web sessions. Each informal session is focused on a specific topic. The open structure also provides for Q&A and discussion of application issues of interest to participants. Additional Information ProximityOne develops geographic-demographic-economic data and analytical tools and helps organizations knit together and use diverse data in a decision-making and analytical framework. We develop custom demographic/economic estimates and projections, develop geographic and geocoded address files, and assist with impact and geospatial analyses. Wide-ranging organizations use our tools (software, data, methodologies) to analyze their own data integrated with other data. Contact ProximityOne (888-364-7656) with questions about data covered in this section or to discuss custom estimates, projections or analyses for your areas of interest. |
|
|