
|
|
|
Between 1970 and 2012, the share of households that were married couples with children under 18 decreased from 40 percent to 20 percent. During this period, the average number of people per household declined from 3.1 to 2.6 (details). These trends vary by state and region. Patterns vary widely at the neighborhood level. What are the characteristics and patterns of households with children under 18 at the neighborhood level? This section illustrates use of CV XE GIS with associated GIS project to examine patterns of children in households by age by block group. Data are based on Census 2010 Summary File 1 Table 32 as shown in the table presented below in this section. See more about the GIS project. San Francisco Area Patterns of Children in Households by Block Group Block groups with 400 or more children in households (item P0320001) appear blue. Block groups with 100-300 children in households appear with green fill pattern. 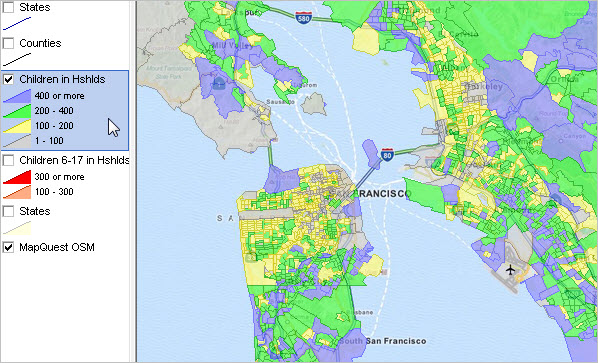 Click graphic for larger view San Francisco Zoom-In Patterns of Children in Households by Block Group Block groups with 400 or more children in households (item P0320001) appear blue. Block groups with 100-300 children in households appear with green fill pattern.  Click graphic for larger view San Francisco Zoom-In Patterns of Children in Households, ages 6-17, by Block Group Illustrating different colors, different ranges, population by age; other ages could be used. 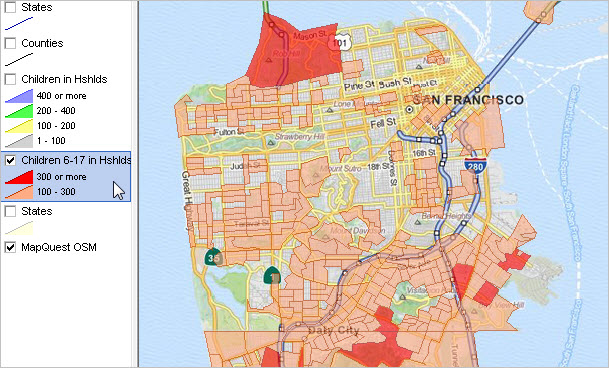 Click graphic for larger view Cupertino Area Zoom-In Patterns of Children in Households, ages 6-17, by Block Group Illustrating further zoom-in, street detail, labels showing total population under 18 years; could be other item as label. Block groups with 300 or more children in households (items P0320009 - P0320012 summed) appear red. Block groups with 100-300 children in households appear with orange fill pattern. 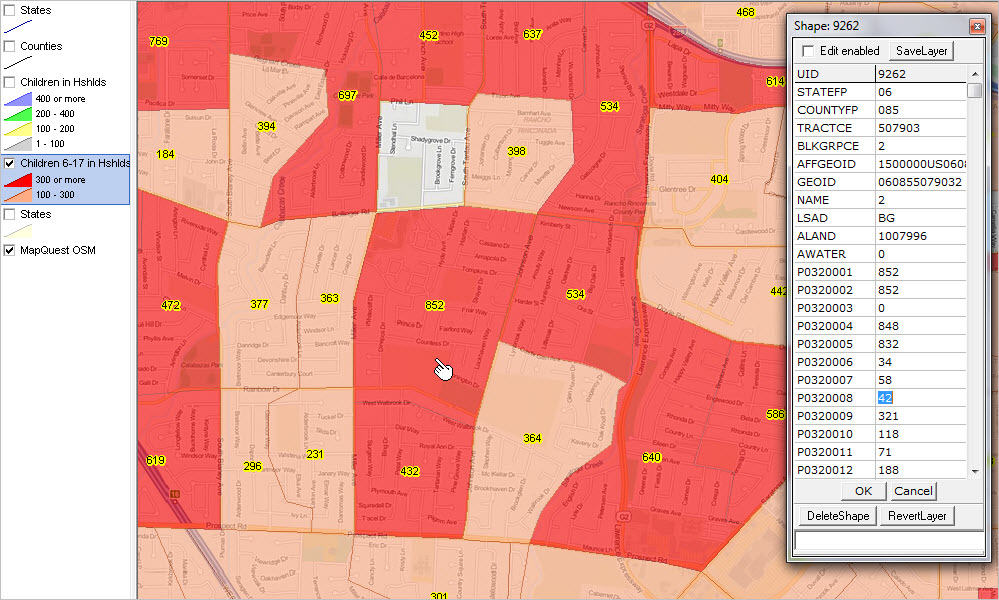 Click graphic for larger view -- larger view use of identify tool to profile a selected block group. Examining Study Areas Using Site Analysis Tool Above view in site analysis mode; selecting three block groups as a study area using SiteAnalysis API tool. See summary profile in lower right section/table; export to HTML or XLS file. Use mouse to cherry pick areas to add and/or use circular area selection.  Click graphic for larger view. Viewing Selected Records in Tabular Form After selecting areas (block groups in this example) that comprise a study area, click the View File in the lower right panel above the grid. The dBrowse feature is started; the selected records dataset can be opened and used. The $$siterecs.dbf is overwritten with each new site selection. It can be optionally be saved to a CSV, TXT or dBase file for later use; possibly merger/comparison with other study area selections.  Click graphic for larger view. GIS Project The GIS project used to develop views shown in this section is focused on the state of California by block group. It can be used to examine patterns similar to those shown here for any area in California. A similar project could be developed for a specific county, another state or the U.S. Data from Census 2010 SF1 Table P32 (see item list below) were merged into the California block group shapefile. Many of the items available in Table P32 were not used in the map views shown here but could be used to develop alternative views; e.g., specific age patterns or percentages. A GIS project is itself a file that knits together a set of layers that have certain settings. In the GIS project used here, the layers mainly reflect attributes of a corresponding shapefile (U.S. by state, U.S. by county and California by block group). Children in Households; Census 2010 Summary File 1; Table P32
P32. HOUSEHOLD TYPE BY RELATIONSHIP BY AGE
FOR THE POPULATION UNDER 18 YEARS [45] Universe: Population under 18 years P0320001 Total P0320002 In households P0320003 Householder or spouse P0320004 Related child: P0320005 Own child: P0320006 Under 3 years P0320007 3 and 4 years P0320008 5 years P0320009 6 to 11 years P0320010 12 and 13 years P0320011 14 years P0320012 15 to 17 years P0320013 Other relatives: P0320014 Under 3 years P0320015 3 and 4 years P0320016 5 years P0320017 6 to 11 years P0320018 12 and 13 years P0320019 14 years P0320020 15 to 17 years P0320021 Nonrelatives: P0320022 Under 3 years P0320023 3 and 4 years P0320024 5 years P0320025 6 to 11 years P0320026 12 and 13 years P0320027 14 years P0320028 15 to 17 years P0320029 In group quarters: P0320030 Institutionalized population: P0320031 Under 3 years P0320032 3 and 4 years P0320033 5 years P0320034 6 to 11 years P0320035 12 and 13 years P0320036 14 years P0320037 15 to 17 years P0320038 Noninstitutionalized population: P0320039 Under 3 years P0320040 3 and 4 years P0320041 5 years P0320042 6 to 11 years P0320043 12 and 13 years P0320044 14 years P0320045 15 to 17 years About Households A household contains one or more people. Everyone living in a housing unit makes up a household. One of the people who owns or rents the residence is designated as the householder. For the purposes of examining family and household composition, two types of households are defined: family and nonfamily. A family household has at least two members related by birth, marriage, or adoption, one of whom is the householder. A nonfamily household can be either a person living alone or a householder who shares the housing unit only with nonrelatives; for example, boarders or roommates. The nonrelatives of the householder may be related to each other. Family households are maintained by married couples or by a man or woman living with other relatives. Children may or may not be present. Nonfamily households are maintained only by men or women with no relatives at home. Own children are a subset of all children; they are the biological, step, or adopted child of the householder or family reference person (in the case of subfamilies) for the universe being considered, whether household, family, or family group. Own children are also limited to children who have never been married, are under the age of 18 (unless otherwise specified), and are not themselves a family reference person. Foster children are not included as own children since they are not related to the householder. Support & DMI Web Sessions Learn more about using resources described in this section. Join us in a Decision-Making Information Web session. There is no fee for these one-hour Web sessions. Each informal session is focused on a specific topic. The open structure also provides for Q&A and discussion of application issues of interest to participants. We can address your specific questions about tools to analyze patterns of children's demographics. Additional Information ProximityOne develops geographic-demographic-economic data and analytical tools and helps organizations knit together and use diverse data in a decision-making and analytical framework. We develop custom demographic/economic estimates and projections, develop geographic and geocoded address files, and assist with impact and geospatial analyses. Wide-ranging organizations use our tools (software, data, methodologies) to analyze their own data integrated with other data. Follow ProximityOne on Twitter at www.twitter.com/proximityone. Contact ProximityOne (888-364-7656) with questions about data covered in this section or to discuss custom estimates, projections or analyses for your areas of interest. |
|
|