|
|
Corresponding City/Place Table Corresponding State/County Table All U.S. Census Tracts Census 2000-ACS 2009 Census 2010 American Community Survey Situation & Outlook Estimates & Projections |
Nebraska Census Tract Demographic Characteristics -- based on ACS 2009 5-year estimates
Educational attainment by census tract in Nebraska ... • high school graduates by tract ... ranges from 47.1% to 100% • college graduates by tract ... ranges from 1.0% to 76.4% Find out which tracts have what values ... click the %HS Grad (or %Coll Grad) twice in the ranking table provided below. The educational attainment measures are among thousands of subject matter items now available for all U.S. census tracts, states, counties, cities, school districts and other geographies based on the American Community Survey 2009 5-year estimates released December 2010. These are the first "richer demographics" for all census tracts since Census 2000. Use the interactive ranking table below to rank/compare/examine selected measures for all Nebraska census tracts. See related national scope state/county and cities/places ranking tables; use links in left panel. See the scope of an additional approximate 600 subject matter items available in the 4-part demographic profile (see descriptions: demographic, social, economic, housing). These data are available organized as datasets ready to use for spreadsheet applications, mapping and GIS analysis and integration with other data. Contact us (mention tract demographic estimates in text section or call 888-364-7656) for additional information. GeoNavigation To view a map of a tract of interest, click the TractCode link in the table. To locate a tract of interest based on a ZIP code or address, find census tract code and then locate that tract code in the table. More about tract geography and codes. Nebraska Census Tract Demographic Characteristics Interactive Ranking Table Data based on ACS 2009 estimates. See related Ranking Tables Main Page Usage: click column header to sort; click again to sort other direction. Column Headers; Subject Matter Items All estimates are based on survey respondent data collected 2005-2009 & centric to mid-2007. • Population -- total population • %Under 5 -- population under age 5 as percent of total population • %Pop 5-17 -- school age population, ages 5-17, as percent of total population • %Pop 65+ -- population age 65 and over as percent of total population • Md Age -- median age • %White -- White population (of one race) as percent of total population • %Black -- Black population (of one race) as percent of total population • %AIAN -- American Indian/Alaska Native population (of one race) as percent of total population • %Asian -- Asian population (of one race) as percent of total population • %NHPI -- Native Hawaiian/Pacific Islander population (of one race) as percent of total population • %Hispanic -- Hispanic population (all races) as percent of total population • %HS Grad -- percent high school graduates (population 25 years and older) • %Coll Grad -- percent college graduates graduates (population 25 years and older) • LSAH [Language Spoken at Home] -- percent who speak language other than English & "do not speak English very well" • $MHI -- median household income • $MFI -- median family income • Poverty -- percent all population in poverty (with income in past 12 months below poverty level) • $MHV -- median housing value (owner-occupied housing units) Ranking Table Usage Notes • Table includes all State census tracts with boundaries defined as of Census 2000. • Click on a column header to sort on that column; click column header again to sort in other direction. • Click ShowAll button to show all areas and restore full set of data view. • Find by Name: key in partial county/area name in text box to right of Find-in-Name button then click button to locate all matches (case sensitive). • See related ranking tables. About Census Tract Geography and Codes Census tracts are defined by the Census Bureau and organized as sub-county building blocks. Census tracts are small geographic areas, designed to average 4,000 population, but vary widely. The approximate 65,000 census tracts covering the U.S. wall-to-wall provide a good geographic granularity to meet many needs. Unchanging throughout the decade, census tract boundaries are subject to update for each decennial census though many will remain unchanged for Census 2010. Census tracts were first designed to be relatively homogeneous with respect to population characteristics, economic status, and living conditions. Over time, with demographic shifts, census tracts are often no longer so homogenous. However, tracts do closely approximate neighborhoods/neighborhood parts for many areas. The geographic size of census tracts varies widely depending on the density of settlement. Census tract boundaries are delineated with the intention of being maintained over many decades so that statistical comparisons can be made from decennial census to decennial census. Census tracts may be split due to population growth or combined as a result of substantial population decline. Census tracts were initially identified by a four-digit basic number and with a two-digit numeric suffix; for example, 6059.02. This version of the tract code is shown in column 3 in the ranking table. The decimal point separating the four-digit basic tract number from the two-digit suffix has been historically shown in printed reports and maps. Many census tracts do not have a suffix; in such cases, the suffix field is either left blank or is zero-filled. Census tract suffixes may range from .01 to .98. These optionally ways of assigning census tract geocodes or handles has led to some vagueness potentially creating problems in handling now common spreadsheet or CSV files. The national scope uniquely identifying tract geocode is the 11 character code shown in column 4 in the ranking table. This is the recommended tract unique identifier, as opposed to the tract code shown in column 3 (often used in map depictions). The tract geocode is of the form SSCCCTTTTTT where SS is the FIPS state code, CCC is the county FIPS code and TTTTTT is the Census assigned tract code. In the tract-only portion of the geocode, there are never blanks or dots and lead zeroes are used for each the state, county and tract code components. As this question sometimes arises, the Census Bureau assigned a default census tract code of 000000 to some coastal and Great Lakes water and territorial sea, rather than extend the census tract boundary into the Great Lakes or to the three-mile limit. 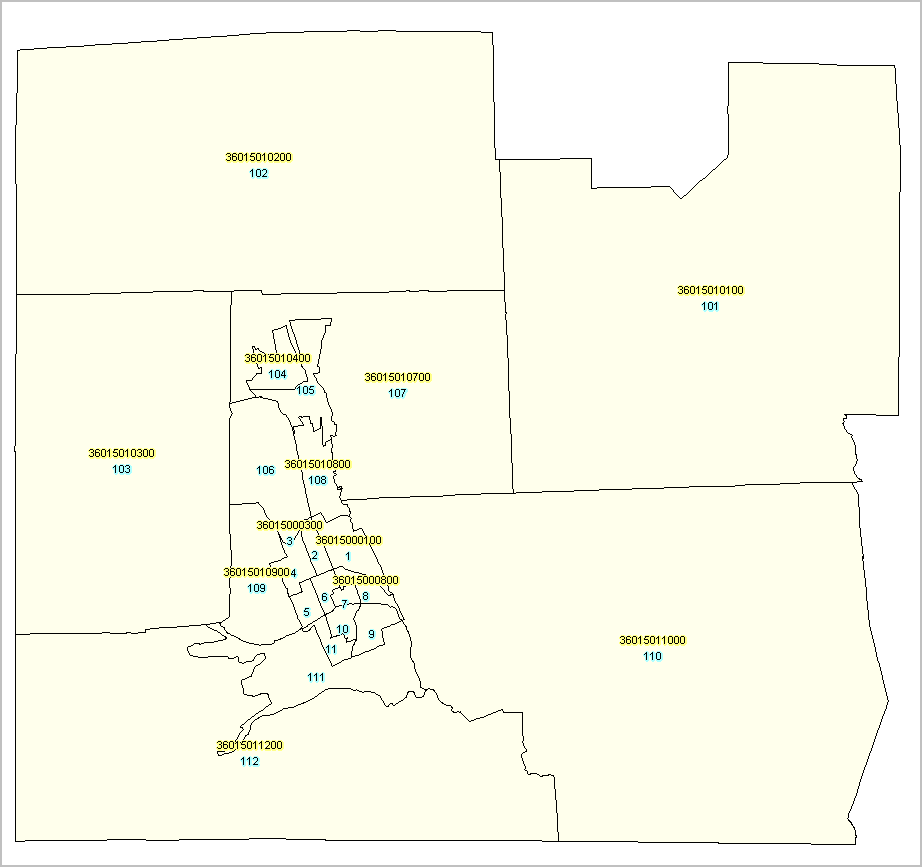 An Example
The graphic at right shows Chemung County, NY by census tract. Click the map for larger view then press F11 key. The map shows tracts comprising the county with blue and yellow labels. The label display option was set to no overlap so not all tract codes appear. Blue tract codes correspond to codes shown in column 3 in the ranking table. Yellow tract codes correspond to codes shown in column 4 in the ranking table. For map display and reference purposes, it is easy to see why the shorter, tract only, code is preferred. Additional Information Proximity develops geodemographic-economic data and analytical tools and helps organizations knit together and use diverse data in a decision-making and analytical framework. We develop custom demographic/economic estimates and projections, develop geographic and geocoded address files, and assist with impact and geospatial analyses. Wide-ranging organizations use our tools (software, data, methodologies) to analyze their own data integrated with other data. Contact Proximity (888-364-7656) with questions about data covered in this section or to discuss custom estimates, projections or analyses for your areas of interest. |
|
|