School Districts

Contents
This section provides an example/tutorial on use of CVXE to develop a custom map focused on a specific school district -- developed from scratch using the CVXE GeoGateway feature. Applications in this section can be developed using the no fee CVXE Viewer as well as Levels 1, 2, 3. Use CVXE installer to install CVXE on your computer.
See more about school districts. See list of school district codes and names.
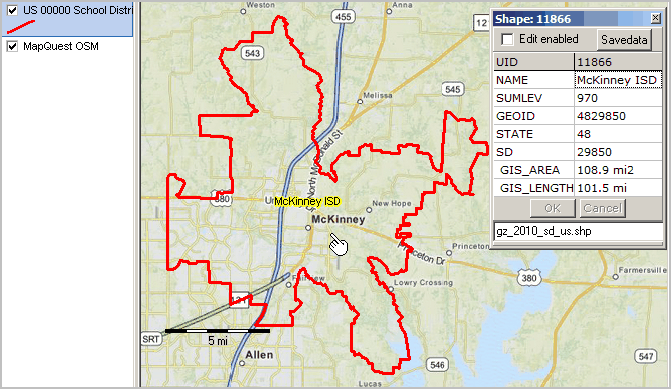
The view below shows the McKinney ISD, TX school district (red boundary) on a OpenStreetMaps base layer. The identify tool is used to click on the district and display the mini-profile.
Replicate these operations with CVXE on your computer. Use CVXE tools to navigate to area of interest (zoom-in to intersection). Add other layers; custom geography and subject matter. Develop maps for school districts of interest to you. See how cities/places, roads, census tracts, etc relate to the school district boundary.
Step 1. To create the above view or for an area of interest ... with CVXE running on your computer, first File>Close any open project.
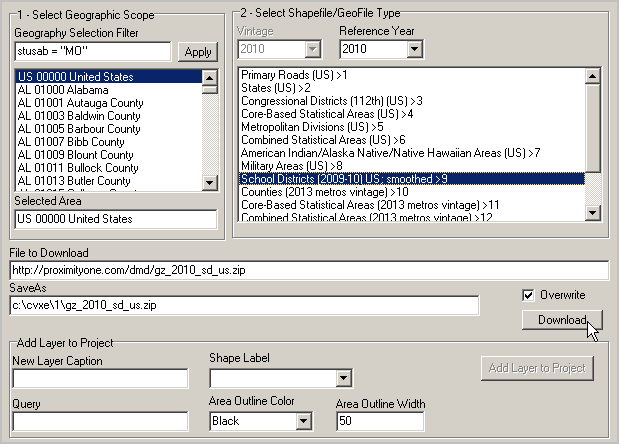
Step 2. Start File>GeoGateway and select (dbl-click) School Districts in Section 2 Select Shapefile.
Click the Download button when File to Download edit populates as shown below.
The GeoGateway feature is available to CVXE Viewer and all CVXE Level users. More about using GeoGateway.
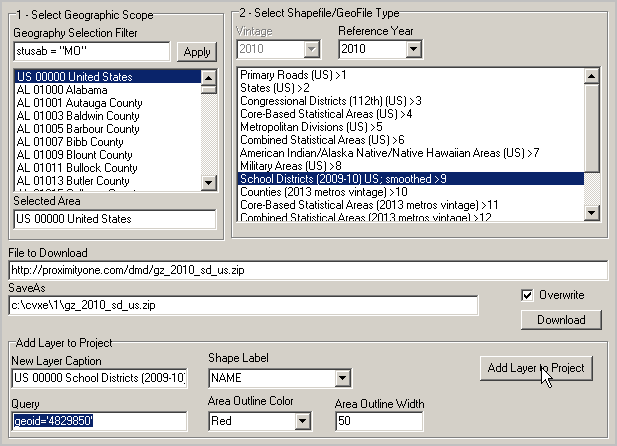
Step 3. After download completes, the Add Layer to Project button becomes enabled.
Key in the exact text <geoid='4829850'> (no pointy brackets) into the Query edit box as shown in the next form.
Click the Add Layer to Project button. After the message (Add another layer ...) close the GeoGateway form.
The map view shown at the top of this page appears.
Usage notes:
1. Query edit box values
| • | the Query edit box value specifies the district to be selected. geoid='4829850' says McKinney ISD, TX. |
| • | to select, for example, Shawnee Mission, KS the Query would be geoid='2011640'. See list of school district codes and names. |
| • | if no Query is specified, the layer is added at full extent of the layer, outline color set to black and outline width set to 1. |
2. Generally Overwrite button should always be checked as it will avoid re-downloading and accelerate processing.
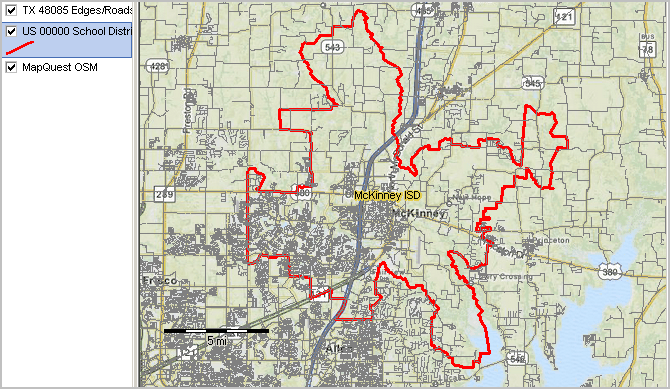
Step 4+ Optionally add other layers ... all roads Collin County, TX ...
Make a map view with overlays for any of the approximate 14,000 school districts
Follow the above steps. In Step three, use the school district geocode of interest to you. In the above example, the query is geoid='4829850'. This says 'show me the school district with school district geoid/code=4829850 (always 7 characters, use lead zeroes, no spaces).
Get your school district code in the column "SDCode" in the interactive table at http://proximityone.com/sddmi.htm. Examples:
| • | Houston ISD, TX Query: geoid='4823640' |
| • | Los Angeles, CA Query: geoid='0622710' |
| • | Shawnee Mission, KS Query: geoid='2011640' |
| • | Scottsdale, AZ Query: geoid='0407570' |
Schedule a One-to-One web meeting; get the results that are right for you.