|
|
|
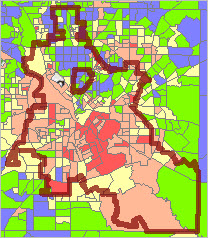
-- tools, data & methods to reach goals and objectives -- patterns & characteristics of Dallas ISD, Texas Data Analytics can help a K-12 school, school system or school district more effectively reach their goals and objectives. Whether traditional, charter, public or private, similar tools and methods apply. This section provides an overview of using geographic-demographic-economic data, Geographic Information System (GIS) tools and data analytics methods for analysis of K-12 schools located in Dallas ISD school district, Texas. Use the interactive table in this section to examine demographic-economic characteristics of Dallas County by block group (areas averaging 1,200 population; 1,168 block group areas comprise Dallas County). Similar data and analyses are available for any set of schools, school districts or counties. Tools and methods described here can help leadership, staff and stakeholders answer key questions and facilitate strategic planning. Examining the Current Situation While most schools and school districts know a lot about the students, often less is known about children's living environment and the broader school district community. See the demographic-economic profile for Dallas ISD total population (compare to Dallas city). The profile tells a story. It helps stakeholders know "where we are now." These profiles are available for all school districts. See more information. Based on data from the American Community Survey (ACS 5-year data), these same data can be used in the interactive ranking tables to compare and contrast one district with another, districts in a state or a peer group. The ACS School District Special Tabulation provides similar data but for the grade relevant population by type of enrollment universe. See Dallas ISD Children's Demographic-Economic Profile by Universe of Enrollment. Small area demographic-economic data can be used to examine children's living environment in vicinity of a school. • Census block and block group level data from Census 2010. - see illustrative view below. • Block group data from the annually updated American Community Survey (ACS 5 year estimates). - see illustrative view below. • Attributes of students enrolled in the school from the U.S. Department of Education. - see illustrative view below. More geographically detailed characteristics for neighborhoods and school locations are reviewed below in this section. Dallas ISD School District in Context Dallas ISD (bold brown boundary) shown in regional context. 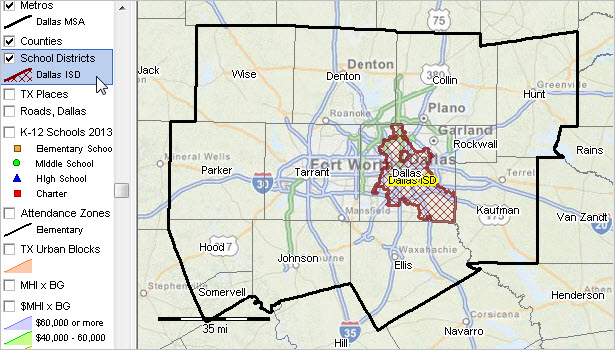 -- view created using CV XE GIS and associated GIS Project -- click graphic for larger showing details. School Locations in Context [goto top] Zoom-in to Dallas ISD. Pointer at county boundary; Dallas ISD is located in Dallas County. Schools are shown by different types of markers. See markers/style in legend at left. Using the query feature, it is possible to identify charter schools as one type of marker, irrespective of grade range. Use the national scope interactive tables to examine characteristics of individual public schools and individual private schools. Rank, query, compare and contrast schools within a state or on a national basis.  -- view created using CV XE GIS and associated GIS Project -- click graphic for larger showing details. Zoom-in View of Schools; School Characteristics [goto top] Further zoom-in shows schools labeled with name. The identify tool is used to show a mini-profile of a school by clicking on the Edna Rowe school marker. The partial view of the profile shows free and reduced lunch participation and enrollment by grade. 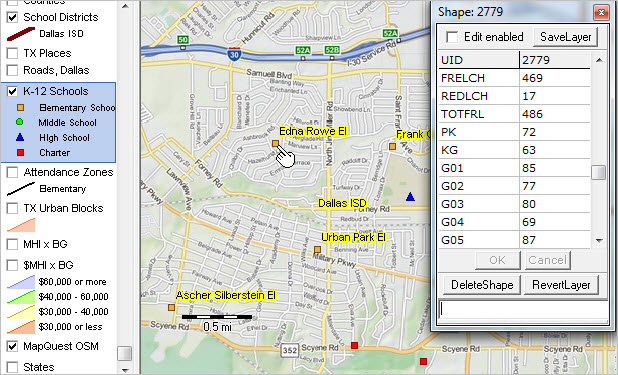 -- view created using CV XE GIS and associated GIS Project -- click graphic for larger showing details. School Attendance Zones [goto top] Elementary school attendance (black boundaries) are shown in the next graphic. Dallas ISD has three types of attendance zones (elementary, middle, high school). The query feature is used to show only elementary zones. Click graphic for larger view showing more detail. 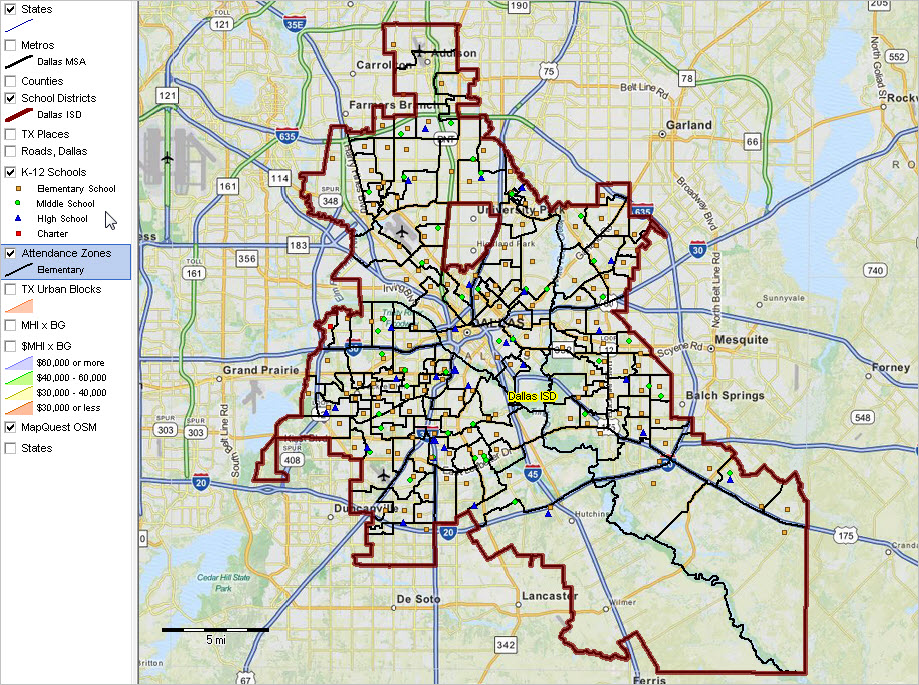 -- view created using CV XE GIS and associated GIS Project -- click graphic for larger showing details. Cities/Places & School District [goto top] Cities/places are shown in the next graphic (cross-hatch pattern) in context with the school district. Places are non-incorporated areas of population concentration. Click graphic for larger view showing more detail; adjacent city/places shown with yellow diagonal cross-hatch pattern.  -- view created using CV XE GIS and associated GIS Project -- click graphic for larger showing details. Road Infrastructure [goto top] Roads/streets are added to the view as shown in the next graphic. Vital to student transportation planning and management, the street density view also helps view the scope of build-out. Click graphic for larger view showing more detail; mini-profile shows attributes of street segment by school/pointer. 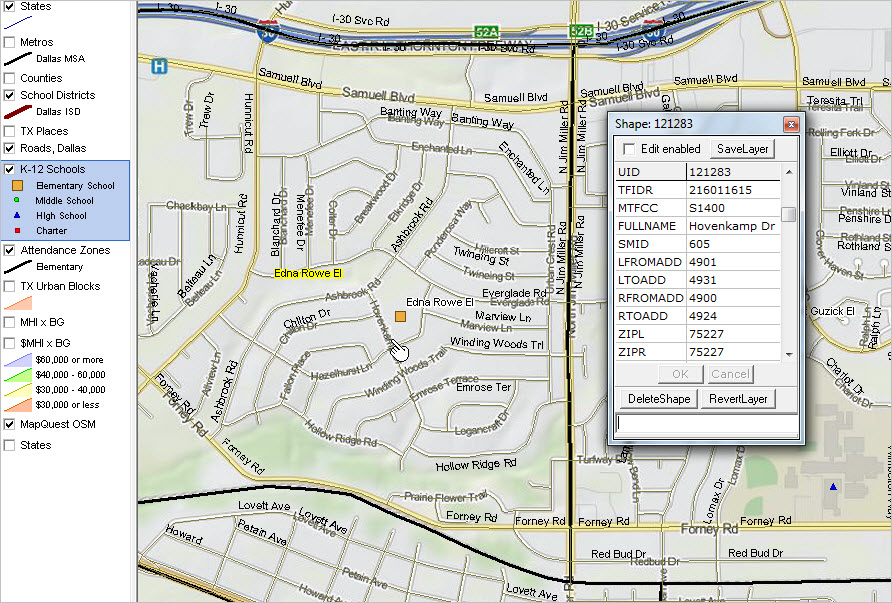 -- view created using CV XE GIS and associated GIS Project -- click graphic for larger showing details. Schools in Context of Urban/Rural Geography [goto top] Census blocks are categorized as urban or rural based on Census 2010. The graphic below shows urban census blocks with an orange fill pattern. It is easy see that most of Dallas ISD is urban; but a large area in the southeast part of the district is rural. See related K-12 Schools by Urban/Rural Status .  -- view created using CV XE GIS and associated GIS Project -- click graphic for larger showing details. Percent Population in Poverty by Census Tract [goto top] Census tracts are statistically defined geographic areas covering the U.S. wall-to-wall (73,057 areas). The view below shows patterns of percent population in poverty by census tract. Click on graphic to view larger view. Choose from hundreds of demographic-economic measures to assess patterns of well-being, age distribution, housing structure and age, educational attainment, housing value, race/origin, employment, language spoken at home among many others.  -- view created using CV XE GIS and associated GIS Project -- click graphic for larger showing details. See zoom-in view of Edna Rowe school vicinity; tracts labeled with tract code and percent in poverty. Patterns of Economic Prosperity by Block Group [goto top] Block groups are statistically defined geographic areas covering the U.S. wall-to-wall (217,740 areas) and nest within census tracts. The view below shows patterns of economic prosperity as measured by the median household income (MHI). MHI interval/color patterns are shown in the highlighted layer at left of the map. Click on graphic to view larger version that uses the MHI as a label for each BG. Choose from hundreds of demographic-economic measures to assess patterns of well-being, age distribution, housing structure and age, educational attainment, housing value, race/origin, employment, language spoken at home among many others. 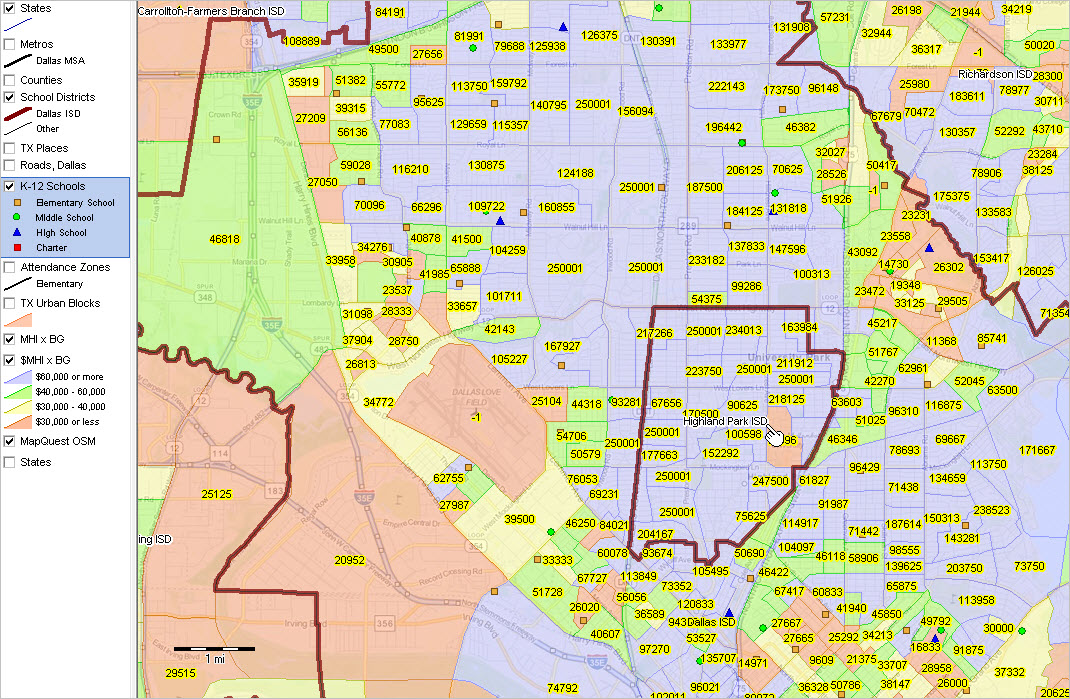 -- view created using CV XE GIS and associated GIS Project -- click graphic for larger showing details. Dallas County Block Group Characteristics Use the interactive table below to view, rank compare Dallas County block group demographic-economic characteristics. See about Dallas County demographic trends. All block groups for the county are included in the table. Optionally key in an address using the location-based demographics tool to determine the block group code of interest. You can then use the Find button below the table to locate that block group. See about using block group codes -- a 12 character code uniquely identifying that area. Dallas County Block Group Demographic-Economic Characteristics -- Interactive Table Table initially sorted by tract-block group. Use the interactive table shown below to examine attributes of block group. Click column header to sort; again to sort other direction. Usage notes below table. See related Ranking Tables Main Page Usage Notes • Click ShowAll between queries/filters. • Median Gross Rent is top coded at $2001. Areas showing $2,001 are $2,000 or more. • Median household income is top coded at $250,000. Areas showing $250,001 are $250,000 or more. • Median housing value is top coded at $1,000,000. Areas showing $1,000,001 are $1,000,000 or more. • -1 value indicates no estimate available for this area. Illustration of using location-based demographics tool. Get census tract (and block and block group) code based on address. Key in address 4918 Hovenkamp Dr, Dallas, TX (Edna Rowe school, used in above views) and click Find button, and determine the census tract code is 48113012206. Enter the tract code in the Find Tract edit box and click Find Tract under table (above) to view all block groups in that tract. 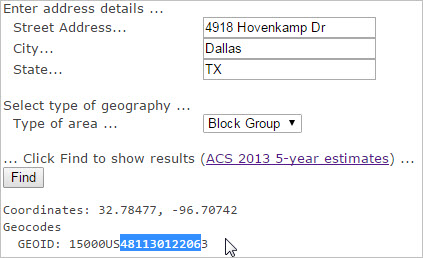 Gini Index of Income Concentration The Gini Index can be used as a measure of income concentration/inequality. The Gini Index is based on the Lorenz curve The Gini Index varies from 0 to 1, with a value of 0 indicating perfect equality, where there is a proportional distribution of income across all households. A value of 1 indicates perfect inequality, where one household has all the income and all others have no income. More about the Gini Index. In the graphic shown below, the Gini Index represents the area (A) between the diagonal, or line of perfect equality, and the Lorenz curve, as a percentage of the total area lying beneath the diagonal (A + B). When income inequality rises, the Lorenz curve bows further downward and the area (A) between it and the diagonal increases in size. The result is that the Gini Index increases.  The Gini Index for the U.S. has ranged 0.470-to-0.480 for the last few years (2014: 0.480. 2013: 0.473, 2012: 0.477, 2011:0.481). The highest block group Gini Index for Dallas County is 0.803 (ACS 2013 5-year estimates). The lowest block group Gini Index value for Dallas County is 0.170. See values in above table. Block Group Income Measures Block group income measures are only available from the American Community Survey (ACS). Block groups are the smallest geographic level for which data are tabulated from the annually updated ACS. In the applications reviewed here, the ACS 2013 5-year estimates are used. Using the block group income inequality measures enables us to examine characteristics of neighborhoods. Support Using these Resources Learn more about demographic economic data and related analytical tools. Join us in a Data Analytics Lab session. There is no fee for these Web sessions. Each informal session is focused on a specific topic. The open structure also provides for Q&A and discussion of application issues of interest to participants. ProximityOne User Group Join the ProximityOne User Group to keep up-to-date with new developments relating to geographic-demographic-economic decision-making information resources. Receive updates and access to tools and resources available only to members. Use this form to join the User Group. Additional Information ProximityOne develops geographic-demographic-economic data and analytical tools and helps organizations knit together and use diverse data in a decision-making and analytical framework. We develop custom demographic/economic estimates and projections, develop geographic and geocoded address files, and assist with impact and geospatial analyses. Wide-ranging organizations use our software, data and methodologies to analyze their own data integrated with other data. Follow ProximityOne on Twitter at www.twitter.com/proximityone. Contact ProximityOne (888-364-7656) with questions about data covered in this section or to discuss custom estimates, projections or analyses for your areas of interest. |
|
|