|
|
|
School District Single Year of Age Demographics -- examining early childhood patterns & population under age 20
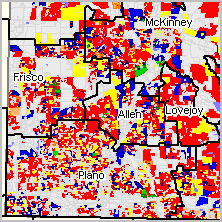
As of Census 2010, the United States population under 1 year of age was 4,218,325 compared to 4,352,356 for the population 5 years of age. The relative size of these age cohorts vary widely for school districts; some increasing and some decreasing. In general, the population under 1 year of age in 2010 will be the core of the population in kindergarten in 2015. Insights can be developed into the 2015 kindergarten through third grade size by school district using the Census 2010 single year of age -- where little enrollment data presently exists to examine these patterns. Data provided in the Census 2010 Summary File 1 enable analysis of single year of age demographics by school district (and a wide range of other geography). These data provide a snapshot of the population by age as of 2010. With population trending in different ways in different parts of the U.S., they provide insights into size of the early childhood population ... and all K-12 grades over the next several years. Use the interactive ranking table presented below to examine single year of age demographic characteristics of individual school districts in context of U.S. overall or by state. The largest school districts (New York, Chicago and Los Angeles) will experience increasing age 5 population over the next several years, as well as Houston ISD which has been flat for several years. Some of the fastest growth areas will experience decreasing age 5 population over the next several years. These data were developed using the Demographic Data Analyst software with the Census 2010 SF1 data. School District Single Year of Age Demographics -- Interactive Ranking Table Single year of age data for ages 0 through 19; use horizontal scroll bar below table to view rightmost columns. Click ShowAll button between Find/Queries. See ranking table usage notes below ranking table. See related ranking tables -- http://proximityone.com/rankingtables.htm. Using the Ranking Table • Click on a column header to sort on that column; click column header again to sort in other direction. • Click ShowAll button to show all tabulation areas and restore full set of data view. • Click State to select on geographies in a selected state (click ShowAll between selections). • Click SumLev to select a type of geography (click ShowAll between selections). • Key in text/area name in text box to right of Find-in-Name button then click button to locate all matches (case sensitive). • Key in Sumlev code 950 (elementary), 960 (secondary) or 970 (unified) to view selected types of districts. Examining Change in the Age 5 Population: 2010 to 2015 The graphic presented below shows the percent change in the age 5 population as of 2010 and the age 5 population as of 2015 (population less than one year as of Census 2010) -- under one scenario: no migration or deaths. The data/view illustrate how the currently available data can be used to examine potential change in early age enrollment and patterns of change for the early childhood cohort. Red shows those blocks with declining age 5 population; blue shows blocks with increasing age 5 population. The identify tool is used to show a mini-profile of one census block (see pointer/hand at bottom of map view). As shown in the profile, the age 5 population in this census block is 25 in 2010 and the age 0 population is 42 in 2010 (age 5 in 2015 under one scenario). Collin County, TX School Districts: Single Year of Age Population Patterns by Census Block 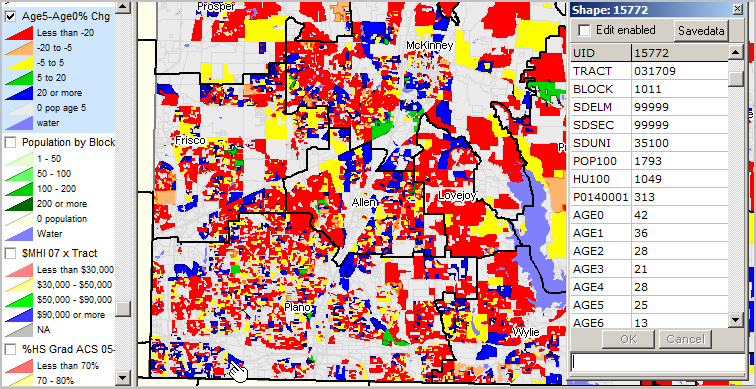
Zoom-in View to Census Block Study Area Showing roads, tax parcels and same mini-profile as above view. 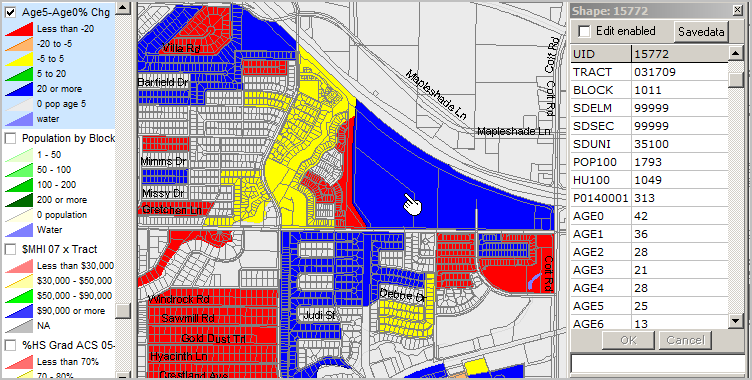
Trends in Births and Fertility Rates Through 2010 The broad-based decline in births and fertility rates from 2007 through 2009 is now well-documented. NCHS data show the overall birth count and fertility rate continuing to decline through the first 6 months of 2010. The NCHS provisional count of births in the United States for 2010 (12-month period ending December 2010) was 4,007,000. This compares to the Census 2010 resident population under 1 year of age data of 4,218,325 (April 1, 2010). The NCHS 2010 birth count was 3 percent less than the number of births in 2009 (4,131,019) and 7 percent less than the all-time high of 4,316,233 births in 2007. See related America's Birth Patterns. Additional Information Proximity develops geographic-demographic-economic data and analytical tools and helps organizations knit together and use diverse data in a decision-making and analytical framework. We develop custom demographic/economic estimates and projections, develop geographic and geocoded address files, and assist with impact and geospatial analyses. Wide-ranging organizations use our tools (software, data, methodologies) to analyze their own data integrated with other data. |
|
|