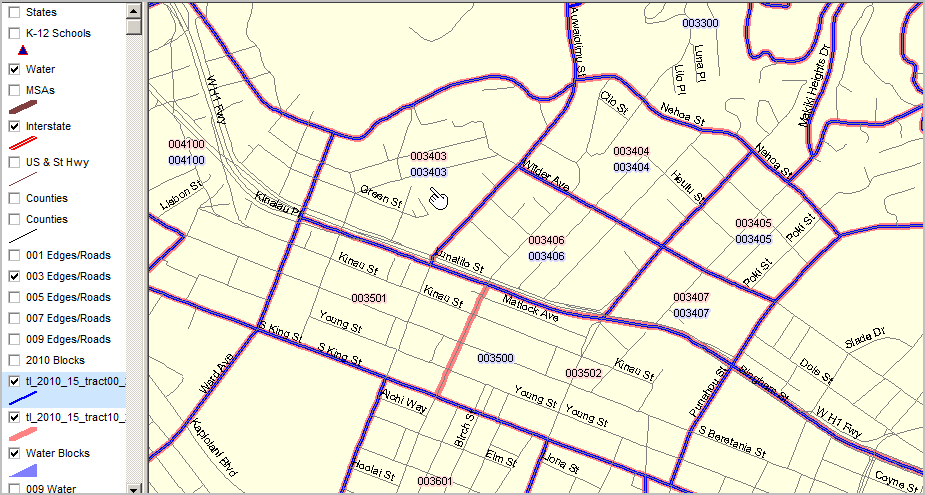
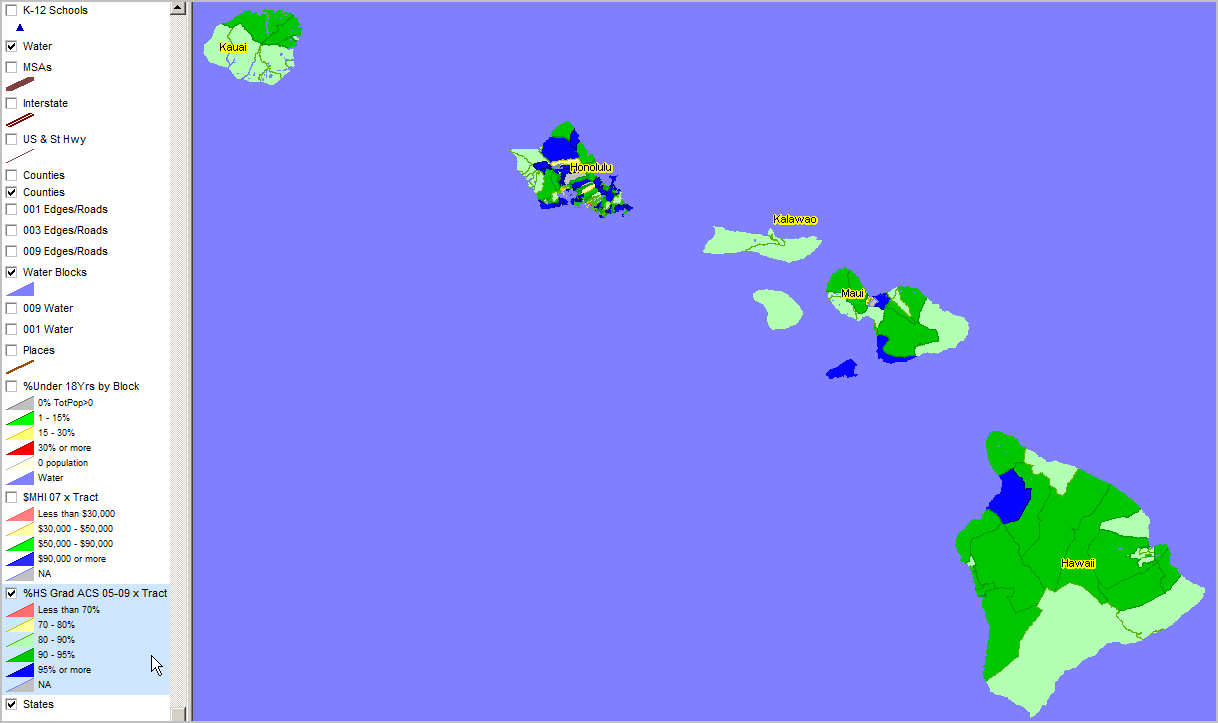
The profile presented below provides a comparative analysis demographic profile for the state, Hawaii County and Hilo city/place based on the Census 2010 Demographic Profile Summary File data. This profile differs from the redistricting data profile in these ways: there are more subject matter items available (e.g. age and household characteristics) and the profile is presented in comparative analysis format -- three areas compared side-by-side. These profiles are available for any Census 2010 geography *down to* the city/place level (no census tracts or school districts, though these data are available in Summary File 1 when released.
Census 2010 Demographic Profile A
Census 2010 Demographic Profile A
ProximityOne -- additional information
| Subject |
Hawaii
HI-040 |
Hawaii County
HI-050-001-25900 |
Hilo CDP
HI-160-14650 |
| | Value | Percent | Value | Percent | Value | Percent |
| GENDER AND AGE | | | | | | |
| Total population | 1,360,301 | 100.0 | 185,079 | 100.0 | 43,263 | 100.0 |
| Under 5 years | 87,407 | 6.4 | 11,845 | 6.4 | 2,597 | 6.0 |
| 5 to 9 years | 83,361 | 6.1 | 11,478 | 6.2 | 2,438 | 5.6 |
| 10 to 14 years | 81,539 | 6.0 | 11,521 | 6.2 | 2,487 | 5.7 |
| 15 to 19 years | 85,994 | 6.3 | 12,089 | 6.5 | 3,244 | 7.5 |
| 20 to 24 years | 95,829 | 7.0 | 10,833 | 5.9 | 3,373 | 7.8 |
| 25 to 29 years | 97,302 | 7.2 | 11,290 | 6.1 | 2,662 | 6.2 |
| 30 to 34 years | 88,031 | 6.5 | 10,935 | 5.9 | 2,326 | 5.4 |
| 35 to 39 years | 86,756 | 6.4 | 10,485 | 5.7 | 2,260 | 5.2 |
| 40 to 44 years | 89,617 | 6.6 | 10,897 | 5.9 | 2,320 | 5.4 |
| 45 to 49 years | 95,787 | 7.0 | 12,657 | 6.8 | 2,719 | 6.3 |
| 50 to 54 years | 97,978 | 7.2 | 14,866 | 8.0 | 3,066 | 7.1 |
| 55 to 59 years | 93,340 | 6.9 | 15,807 | 8.5 | 3,225 | 7.5 |
| 60 to 64 years | 82,222 | 6.0 | 13,542 | 7.3 | 2,739 | 6.3 |
| 65 to 69 years | 59,170 | 4.3 | 9,178 | 5.0 | 2,159 | 5.0 |
| 70 to 74 years | 41,353 | 3.0 | 5,830 | 3.2 | 1,517 | 3.5 |
| 75 to 79 years | 34,675 | 2.5 | 4,571 | 2.5 | 1,441 | 3.3 |
| 80 to 84 years | 29,702 | 2.2 | 3,652 | 2.0 | 1,308 | 3.0 |
| 85 years and over | 30,238 | 2.2 | 3,603 | 1.9 | 1,382 | 3.2 |
| | | | | | | |
| Median age (years) | 38.6 | (X) | 40.9 | (X) | 40.5 | (X) |
| | | | | | | |
| 16 years and over | 1,091,079 | 80.2 | 147,859 | 79.9 | 35,193 | 81.3 |
| 18 years and over | 1,056,483 | 77.7 | 142,799 | 77.2 | 34,034 | 78.7 |
| 21 years and over | 1,003,512 | 73.8 | 135,977 | 73.5 | 31,733 | 73.3 |
| 62 years and over | 241,984 | 17.8 | 34,429 | 18.6 | 9,342 | 21.6 |
| 65 years and over | 195,138 | 14.3 | 26,834 | 14.5 | 7,807 | 18.0 |
| | | | | | | |
| Male population | 681,243 | 50.1 | 92,821 | 50.2 | 21,131 | 48.8 |
| Under 5 years | 45,019 | 3.3 | 6,037 | 3.3 | 1,329 | 3.1 |
| 5 to 9 years | 42,847 | 3.1 | 5,945 | 3.2 | 1,226 | 2.8 |
| 10 to 14 years | 41,699 | 3.1 | 5,906 | 3.2 | 1,325 | 3.1 |
| 15 to 19 years | 44,590 | 3.3 | 6,288 | 3.4 | 1,650 | 3.8 |
| 20 to 24 years | 51,981 | 3.8 | 5,554 | 3.0 | 1,646 | 3.8 |
| 25 to 29 years | 50,683 | 3.7 | 5,628 | 3.0 | 1,336 | 3.1 |
| 30 to 34 years | 44,921 | 3.3 | 5,515 | 3.0 | 1,153 | 2.7 |
| 35 to 39 years | 43,994 | 3.2 | 5,276 | 2.9 | 1,148 | 2.7 |
| 40 to 44 years | 45,253 | 3.3 | 5,475 | 3.0 | 1,130 | 2.6 |
| 45 to 49 years | 48,213 | 3.5 | 6,262 | 3.4 | 1,322 | 3.1 |
| 50 to 54 years | 48,831 | 3.6 | 7,366 | 4.0 | 1,503 | 3.5 |
| 55 to 59 years | 46,148 | 3.4 | 7,836 | 4.2 | 1,556 | 3.6 |
| 60 to 64 years | 40,879 | 3.0 | 7,103 | 3.8 | 1,378 | 3.2 |
| 65 to 69 years | 28,849 | 2.1 | 4,731 | 2.6 | 1,095 | 2.5 |
| 70 to 74 years | 19,140 | 1.4 | 2,842 | 1.5 | 681 | 1.6 |
| 75 to 79 years | 14,940 | 1.1 | 2,102 | 1.1 | 617 | 1.4 |
| 80 to 84 years | 11,904 | 0.9 | 1,575 | 0.9 | 551 | 1.3 |
| 85 years and over | 11,352 | 0.8 | 1,380 | 0.7 | 485 | 1.1 |
| | | | | | | |
| Median age (years) | 37.2 | (X) | 40.2 | (X) | 39.0 | (X) |
| | | | | | | |
| 16 years and over | 543,085 | 39.9 | 73,723 | 39.8 | 16,962 | 39.2 |
| 18 years and over | 525,231 | 38.6 | 71,057 | 38.4 | 16,357 | 37.8 |
| 21 years and over | 497,216 | 36.6 | 67,544 | 36.5 | 15,255 | 35.3 |
| 62 years and over | 109,448 | 8.0 | 16,694 | 9.0 | 4,198 | 9.7 |
| 65 years and over | 86,185 | 6.3 | 12,630 | 6.8 | 3,429 | 7.9 |
| | | | | | | |
| Female population | 679,058 | 49.9 | 92,258 | 49.8 | 22,132 | 51.2 |
| Under 5 years | 42,388 | 3.1 | 5,808 | 3.1 | 1,268 | 2.9 |
| 5 to 9 years | 40,514 | 3.0 | 5,533 | 3.0 | 1,212 | 2.8 |
| 10 to 14 years | 39,840 | 2.9 | 5,615 | 3.0 | 1,162 | 2.7 |
| 15 to 19 years | 41,404 | 3.0 | 5,801 | 3.1 | 1,594 | 3.7 |
| 20 to 24 years | 43,848 | 3.2 | 5,279 | 2.9 | 1,727 | 4.0 |
| 25 to 29 years | 46,619 | 3.4 | 5,662 | 3.1 | 1,326 | 3.1 |
| 30 to 34 years | 43,110 | 3.2 | 5,420 | 2.9 | 1,173 | 2.7 |
| 35 to 39 years | 42,762 | 3.1 | 5,209 | 2.8 | 1,112 | 2.6 |
| 40 to 44 years | 44,364 | 3.3 | 5,422 | 2.9 | 1,190 | 2.8 |
| 45 to 49 years | 47,574 | 3.5 | 6,395 | 3.5 | 1,397 | 3.2 |
| 50 to 54 years | 49,147 | 3.6 | 7,500 | 4.1 | 1,563 | 3.6 |
| 55 to 59 years | 47,192 | 3.5 | 7,971 | 4.3 | 1,669 | 3.9 |
| 60 to 64 years | 41,343 | 3.0 | 6,439 | 3.5 | 1,361 | 3.1 |
| 65 to 69 years | 30,321 | 2.2 | 4,447 | 2.4 | 1,064 | 2.5 |
| 70 to 74 years | 22,213 | 1.6 | 2,988 | 1.6 | 836 | 1.9 |
| 75 to 79 years | 19,735 | 1.5 | 2,469 | 1.3 | 824 | 1.9 |
| 80 to 84 years | 17,798 | 1.3 | 2,077 | 1.1 | 757 | 1.7 |
| 85 years and over | 18,886 | 1.4 | 2,223 | 1.2 | 897 | 2.1 |
| | | | | | | |
| Median age (years) | 39.9 | (X) | 41.5 | (X) | 41.9 | (X) |
| | | | | | | |
| 16 years and over | 547,994 | 40.3 | 74,136 | 40.1 | 18,231 | 42.1 |
| 18 years and over | 531,252 | 39.1 | 71,742 | 38.8 | 17,677 | 40.9 |
| 21 years and over | 506,296 | 37.2 | 68,433 | 37.0 | 16,478 | 38.1 |
| 62 years and over | 132,536 | 9.7 | 17,735 | 9.6 | 5,144 | 11.9 |
| 65 years and over | 108,953 | 8.0 | 14,204 | 7.7 | 4,378 | 10.1 |
| | | | | | | |
| RACE | | | | | | |
| Total population | 1,360,301 | 100.0 | 185,079 | 100.0 | 43,263 | 100.0 |
| One Race | 1,039,672 | 76.4 | 130,544 | 70.5 | 29,199 | 67.5 |
| White | 336,599 | 24.7 | 62,348 | 33.7 | 7,617 | 17.6 |
| Black or African American | 21,424 | 1.6 | 1,020 | 0.6 | 227 | 0.5 |
| American Indian and Alaska Native | 4,164 | 0.3 | 869 | 0.5 | 132 | 0.3 |
| Asian | 525,078 | 38.6 | 41,050 | 22.2 | 14,833 | 34.3 |
| Asian Indian | 2,201 | 0.2 | 175 | 0.1 | 49 | 0.1 |
| Chinese | 54,955 | 4.0 | 1,661 | 0.9 | 645 | 1.5 |
| Filipino | 197,497 | 14.5 | 15,834 | 8.6 | 2,637 | 6.1 |
| Japanese | 185,502 | 13.6 | 18,086 | 9.8 | 9,550 | 22.1 |
| Korean | 24,203 | 1.8 | 1,005 | 0.5 | 419 | 1.0 |
| Vietnamese | 9,779 | 0.7 | 317 | 0.2 | 105 | 0.2 |
| Other Asian [1] | 50,941 | 3.7 | 3,972 | 2.1 | 1,428 | 3.3 |
| Native Hawaiian and Other Pacific Islander | 135,422 | 10.0 | 22,389 | 12.1 | 6,132 | 14.2 |
| Native Hawaiian | 80,337 | 5.9 | 15,812 | 8.5 | 4,467 | 10.3 |
| Guamanian or Chamorro | 2,700 | 0.2 | 187 | 0.1 | 43 | 0.1 |
| Samoan | 18,287 | 1.3 | 576 | 0.3 | 140 | 0.3 |
| Other Pacific Islander [2] | 34,098 | 2.5 | 5,814 | 3.1 | 1,482 | 3.4 |
| Some Other Race | 16,985 | 1.2 | 2,868 | 1.5 | 258 | 0.6 |
| Two or More Races | 320,629 | 23.6 | 54,535 | 29.5 | 14,064 | 32.5 |
| White; American Indian and Alaska Native [3] | 7,932 | 0.6 | 2,147 | 1.2 | 293 | 0.7 |
| White; Asian [3] | 66,456 | 4.9 | 8,918 | 4.8 | 2,586 | 6.0 |
| White; Black or African American [3] | 3,883 | 0.3 | 509 | 0.3 | 85 | 0.2 |
| White; Some Other Race [3] | 3,394 | 0.2 | 474 | 0.3 | 81 | 0.2 |
| | | | | | | |
| Race alone or in combination with other races: [4] | | | | | | |
| White | 564,323 | 41.5 | 101,344 | 54.8 | 17,664 | 40.8 |
| Black or African American | 38,820 | 2.9 | 2,975 | 1.6 | 653 | 1.5 |
| American Indian and Alaska Native | 33,470 | 2.5 | 7,210 | 3.9 | 1,454 | 3.4 |
| Asian | 780,968 | 57.4 | 82,944 | 44.8 | 26,420 | 61.1 |
| Native Hawaiian and Other Pacific Islander | 355,816 | 26.2 | 62,487 | 33.8 | 16,587 | 38.3 |
| Some Other Race | 34,199 | 2.5 | 5,450 | 2.9 | 808 | 1.9 |
| | | | | | | |
| HISPANIC OR LATINO | | | | | | |
| Total population | 1,360,301 | 100.0 | 185,079 | 100.0 | 43,263 | 100.0 |
| Hispanic or Latino (of any race) | 120,842 | 8.9 | 21,383 | 11.6 | 4,501 | 10.4 |
| Mexican | 35,415 | 2.6 | 5,868 | 3.2 | 781 | 1.8 |
| Puerto Rican | 44,116 | 3.2 | 9,520 | 5.1 | 2,350 | 5.4 |
| Cuban | 1,544 | 0.1 | 237 | 0.1 | 71 | 0.2 |
| Other Hispanic or Latino [5] | 39,767 | 2.9 | 5,758 | 3.1 | 1,299 | 3.0 |
| Not Hispanic or Latino | 1,239,459 | 91.1 | 163,696 | 88.4 | 38,762 | 89.6 |
| | | | | | | |
| HISPANIC OR LATINO AND RACE | | | | | | |
| Total population | 1,360,301 | 100.0 | 185,079 | 100.0 | 43,263 | 100.0 |
| Hispanic or Latino | 120,842 | 8.9 | 21,383 | 11.6 | 4,501 | 10.4 |
| White alone | 27,256 | 2.0 | 4,517 | 2.4 | 723 | 1.7 |
| Black or African American alone | 1,520 | 0.1 | 121 | 0.1 | 29 | 0.1 |
| American Indian and Alaska Native alone | 1,341 | 0.1 | 283 | 0.2 | 50 | 0.1 |
| Asian alone | 11,784 | 0.9 | 1,462 | 0.8 | 383 | 0.9 |
| Native Hawaiian and Other Pacific Islander alone | 7,200 | 0.5 | 1,419 | 0.8 | 361 | 0.8 |
| Some Other Race alone | 15,097 | 1.1 | 2,587 | 1.4 | 207 | 0.5 |
| Two or More Races | 56,644 | 4.2 | 10,994 | 5.9 | 2,748 | 6.4 |
| Not Hispanic or Latino | 1,239,459 | 91.1 | 163,696 | 88.4 | 38,762 | 89.6 |
| White alone | 309,343 | 22.7 | 57,831 | 31.2 | 6,894 | 15.9 |
| Black or African American alone | 19,904 | 1.5 | 899 | 0.5 | 198 | 0.5 |
| American Indian and Alaska Native alone | 2,823 | 0.2 | 586 | 0.3 | 82 | 0.2 |
| Asian alone | 513,294 | 37.7 | 39,588 | 21.4 | 14,450 | 33.4 |
| Native Hawaiian and Other Pacific Islander alone | 128,222 | 9.4 | 20,970 | 11.3 | 5,771 | 13.3 |
| Some Other Race alone | 1,888 | 0.1 | 281 | 0.2 | 51 | 0.1 |
| Two or More Races | 263,985 | 19.4 | 43,541 | 23.5 | 11,316 | 26.2 |
| | | | | | | |
| RELATIONSHIP | | | | | | |
| Total population | 1,360,301 | 100.0 | 185,079 | 100.0 | 43,263 | 100.0 |
| In households | 1,317,421 | 96.8 | 181,435 | 98.0 | 41,615 | 96.2 |
| Householder | 455,338 | 33.5 | 67,096 | 36.3 | 15,483 | 35.8 |
| Spouse [6] | 230,076 | 16.9 | 31,834 | 17.2 | 7,034 | 16.3 |
| Child | 362,370 | 26.6 | 47,628 | 25.7 | 11,053 | 25.5 |
| Own child under 18 years | 230,892 | 17.0 | 32,560 | 17.6 | 6,998 | 16.2 |
| Other relatives | 167,820 | 12.3 | 19,123 | 10.3 | 4,521 | 10.5 |
| Under 18 years | 63,047 | 4.6 | 8,137 | 4.4 | 1,876 | 4.3 |
| 65 years and over | 26,845 | 2.0 | 2,615 | 1.4 | 677 | 1.6 |
| Nonrelatives | 101,817 | 7.5 | 15,754 | 8.5 | 3,524 | 8.1 |
| Under 18 years | 7,174 | 0.5 | 1,217 | 0.7 | 260 | 0.6 |
| 65 years and over | 7,634 | 0.6 | 1,053 | 0.6 | 228 | 0.5 |
| | | | | | | |
| Unmarried partner | 33,068 | 2.4 | 6,627 | 3.6 | 1,283 | 3.0 |
| In group quarters | 42,880 | 3.2 | 3,644 | 2.0 | 1,648 | 3.8 |
| Institutionalized population | 11,306 | 0.8 | 1,563 | 0.8 | 605 | 1.4 |
| Male | 6,802 | 0.5 | 889 | 0.5 | 241 | 0.6 |
| Female | 4,504 | 0.3 | 674 | 0.4 | 364 | 0.8 |
| Noninstitutionalized population | 31,574 | 2.3 | 2,081 | 1.1 | 1,043 | 2.4 |
| Male | 21,517 | 1.6 | 1,069 | 0.6 | 527 | 1.2 |
| Female | 10,057 | 0.7 | 1,012 | 0.5 | 516 | 1.2 |
| | | | | | | |
| HOUSEHOLDS BY TYPE | | | | | | |
| Total households | 455,338 | 100.0 | 67,096 | 100.0 | 15,483 | 100.0 |
| Family households (families) [7] | 313,907 | 68.9 | 44,407 | 66.2 | 10,287 | 66.4 |
| With own children under 18 years | 126,155 | 27.7 | 17,296 | 25.8 | 3,766 | 24.3 |
| Husband-wife family | 230,076 | 50.5 | 31,834 | 47.4 | 7,034 | 45.4 |
| With own children under 18 years | 91,610 | 20.1 | 11,141 | 16.6 | 2,307 | 14.9 |
| Male householder, no wife present | 26,590 | 5.8 | 4,315 | 6.4 | 975 | 6.3 |
| With own children under 18 years | 10,737 | 2.4 | 2,101 | 3.1 | 432 | 2.8 |
| Female householder, no husband present | 57,241 | 12.6 | 8,258 | 12.3 | 2,278 | 14.7 |
| With own children under 18 years | 23,808 | 5.2 | 4,054 | 6.0 | 1,027 | 6.6 |
| Nonfamily households [7] | 141,431 | 31.1 | 22,689 | 33.8 | 5,196 | 33.6 |
| Householder living alone | 106,175 | 23.3 | 16,843 | 25.1 | 3,992 | 25.8 |
| Male | 51,465 | 11.3 | 8,593 | 12.8 | 1,854 | 12.0 |
| 65 years and over | 12,371 | 2.7 | 2,197 | 3.3 | 587 | 3.8 |
| Female | 54,710 | 12.0 | 8,250 | 12.3 | 2,138 | 13.8 |
| 65 years and over | 24,603 | 5.4 | 3,690 | 5.5 | 1,170 | 7.6 |
| | | | | | | |
| Households with individuals under 18 years | 156,045 | 34.3 | 21,340 | 31.8 | 4,770 | 30.8 |
| Households with individuals 65 years and over | 137,815 | 30.3 | 19,541 | 29.1 | 5,386 | 34.8 |
| | | | | | | |
| Average household size | 2.90 | (X) | 2.70 | (X) | 2.70 | (X) |
| Average family size [7] | 3.42 | (X) | 3.22 | (X) | 3.20 | (X) |
| | | | | | | |
| HOUSING OCCUPANCY | | | | | | |
| Total housing units | 519,508 | 100.0 | 82,324 | 100.0 | 16,905 | 100.0 |
| Occupied housing units | 455,338 | 87.6 | 67,096 | 81.5 | 15,483 | 91.6 |
| Vacant housing units | 64,170 | 12.4 | 15,228 | 18.5 | 1,422 | 8.4 |
| For rent | 16,441 | 3.2 | 2,995 | 3.6 | 432 | 2.6 |
| Rented, not occupied | 954 | 0.2 | 101 | 0.1 | 11 | 0.1 |
| For sale only | 4,277 | 0.8 | 1,338 | 1.6 | 108 | 0.6 |
| Sold, not occupied | 1,151 | 0.2 | 289 | 0.4 | 12 | 0.1 |
| For seasonal, recreational, or occasional use | 30,079 | 5.8 | 7,135 | 8.7 | 258 | 1.5 |
| All other vacants | 11,268 | 2.2 | 3,370 | 4.1 | 601 | 3.6 |
| | | | | | | |
| Homeowner vacancy rate (percent) [8] | 1.60 | (X) | 2.90 | (X) | 1.10 | (X) |
| Rental vacancy rate (percent) [9] | 7.80 | (X) | 11.60 | (X) | 6.90 | (X) |
| | | | | | | |
| HOUSING TENURE | | | | | | |
| Occupied housing units | 455,338 | 100.0 | 67,096 | 100.0 | 15,483 | 100.0 |
| Owner-occupied housing units | 262,682 | 57.7 | 44,271 | 66.0 | 9,623 | 62.2 |
| Population in owner-occupied housing units | 793,160 | (X) | 119,236 | (X) | 26,400 | (X) |
| Average household size of owner-occupied units | 3.02 | (X) | 2.69 | (X) | 2.74 | (X) |
| Renter-occupied housing units | 192,656 | 42.3 | 22,825 | 34.0 | 5,860 | 37.8 |
| Population in renter-occupied housing units | 524,261 | (X) | 62,199 | (X) | 15,215 | (X) |
| Average household size of renter-occupied units | 2.72 | (X) | 2.73 | (X) | 2.60 | (X) |
| | | | | | | |
| | | | | | | |
Data source: Census 2010.
|