|
|
|
County Income & Poverty Patterns School District DMI Main |
School District Population and Poverty Patterns
Update Note. These data have been updated; new data were released in December 2010. See http://proximityone.com/sd0910.htm.
School District Poverty Interactive Ranking Table Click column header to sort; click again to sort other direction. See related Ranking Tables Main Page Ranking Table Column Descriptions 1 - School District Name -- as of 2007-08 school year 2 - St -- State postal abbreviation 3 - Code -- Federal school district code -- as of 2007-08 school year 4 - State Code -- State district code 5 - ZIP Code -- ZIP code of school district administrative address -- 2006-07 school year 6 - Low grade -- lowest grade for which instruction is provided within district -- 2006-07 school year 7 - High grade -- highest grade for which instruction is provided within district -- 2006-07 school year items 8-11 are estimates for 2007 based on school districts as of 2007-08 school year geography 8 - Tot Pop -- Total Population 9 - Pop 5-17 -- Age Relevant Population ages 5-17 10 - 5-17 Pov -- Grade/age Relevant Population ages 5-17 who are related children in families in poverty 11 - 5-17 Pov% -- Percent grade/age relevant population ages 5-17 in poverty (item 10 as proportion of item 9) items 12-14 are school reported data for the 2006-07 school year 12 - PK12 -- enrollment in grades PK-12 as reported by schools 2006-07 school year 13 - FRL -- total free and reduced lunch students as reported by schools 2006-07 school year 14 - FRL% -- FRL and percent of PK12 All population estimates (items 8-11) are as of 7/1/2007. All estimates (items 8-11) are subject to estimation error and a margin of error can be computed for each estimate. School district geography for items 1-3 and 8-11 are as defined for the 2007-08 (January 1, 2008) school year. For school reported data, some data are not reported for some schools (e.g. FRL) and thus may be 0 or an undercount. Patterns of Population Ages 5-to-17 in Poverty by 2007-08 School District The following map shows patterns of population ages 5-to-17 in poverty by 2007-08 school district prepared using CommunityViewer (CV) GIS. This view shows all unified and secondary school districts. Use CV with the corresponding GIS project on your own computer to examine patterns for focused geographic areas. Add other types of geography. Add other subject matter data. Modify intervals and the way patterns are displayed. Export map graphics for use in your documents and Web pages. Use these tools for collaborative purposes with stakeholders. 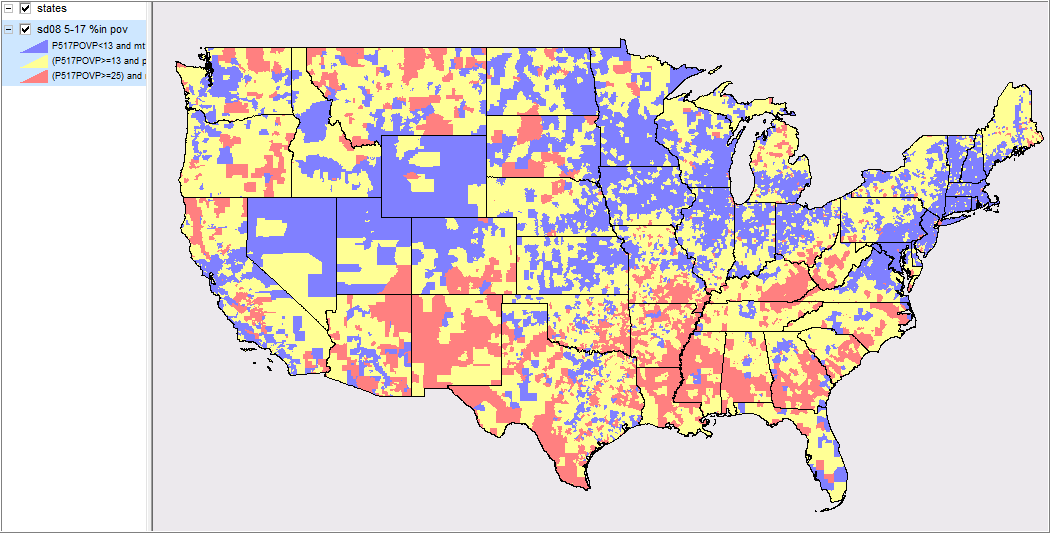
Patterns of item 11 in the above table -- blue less than 13%, yellow 13-25%, red 25% or more. Click for larger view; press F11 key on display for best view. Poverty Official Definition. Estimates of the population in poverty are developed by many Federal statistical programs. Estimates provided in the ranking table (items 8 through 11) have been developed using a specific Census Bureau modeling methodology. More generally and following the Office of Management and Budget (OMB) statistical policy, the Census Bureau uses a set of money income thresholds that vary by family size and composition to determine who is in poverty. If a family’s total income is less than the family’s threshold, then that family and every individual in it is considered in poverty. The official poverty thresholds do not vary geographically, but they are updated for inflation using Consumer Price Index. The official poverty definition uses money income before taxes and does not include capital gains or noncash benefits (such as public housing, Medicaid, and food stamps). Additional Information. Proximity develops custom demographic estimates and projections for schools, attendance zones, school districts and other geography. Schools and school districts use our tools (software, data, methodologies) to analyze their own data. Contact Proximity (888-364-7656) with questions about data covered in this section or to discuss custom estimates, projections or analyses for your areas of interest. |
|
|