
|
|
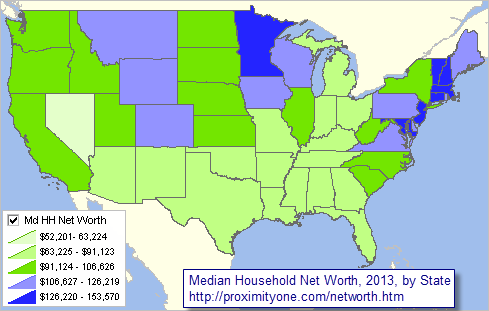
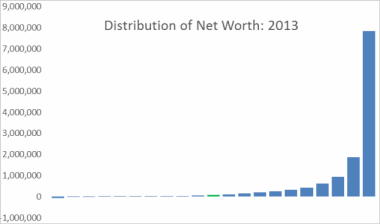
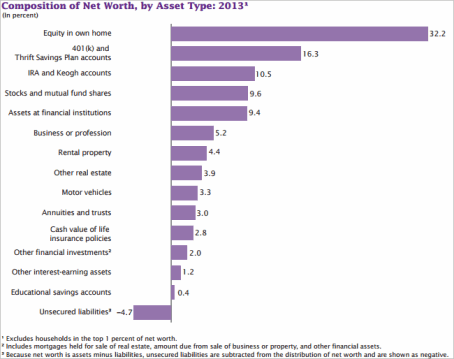
-- tools & data to examine national and sub-national characteristics June 2017. The U.S. median household net worth was $96,679 in 2013; the most recent estimate available. How is the wealth geographically distributed? Net worth (or wealth) is an important indicator of economic well-being. Because income alone does not provide a complete picture, measuring net worth is vital to understanding the economic health of households in the U.S. This section provides access to estimates of wealth and inequality at the national and sub-national levels. Use the interactive table shown below to see that state median net worth ranges from $52,201 to $153,570. Patterns of State Net Worth by State Use the CV XE GIS software with U.S. by state net worth GIS project to examine characteristics of net worth and related measures. The following view shows patterns of state 2013 median household net worth. Use the interactive table below to view, rank, compare states by net worth and related measures.  - View developed using the CV XE GIS software. - Click graphic for larger view showing states labeled with median household net worth. Developing State and Sub-State Measures of Net Worth Household net worth, or wealth, is known to exhibit a highly skewed distribution. Estimates of wealth concentration show that the top 0.1 percent of families held 22 percent of the wealth owned by U.S. households in 2012. Household wealth is a difficult concept to measure. To create reliable estimates of net worth for small demographic groups or for subnational geographies, a data source that is large enough to allow reliable subgroup analysis and that is comprehensive enough to allow a direct construction of net worth. At present, no such data source exists in the U.S. The Highly Skewed Distribution of Wealth The following graphic shows the highly skewed distribution of wealth developed using the 2013 Survey of Consumer Finances and based on Census Bureau analyses. Bars represent the 1st, 99th, and every 5th percentile from the 5th to the 95th percentile. It is easy to see why there is a very large difference between the median household net worth (U.S. $96,679) and mean household net worth (U.S. $2,561,365).  Developing SubNational Household Net Worth Estimates Research by Census Bureau combines information from the Survey of Income and Program Participation (SIPP) and the American Community Survey (ACS) to create wealth estimates for smaller geographies and populations than previously available. The SIPP is nationally representative and has rich and detailed information on wealth, while the ACS has more limited information on wealth but has a very rich sample with a diversity of geographic areas represented. A model of household net worth based on SIPP data is first estimated. The resulting estimates are used to estimate net worth for ACS households. Net Worth at the National Level Median net worth of U.S. households in 2013 was $80,039. This estimate comes from the 2014 panel of the Survey of Income and Program Participation (SIPP), which is the first panel of the survey's second major instrument redesign. SIPP began measuring household net worth in 1984. Over time, changing asset ownership trends and financial offerings alter what makes up a household's net worth. As a result, the measurement of net worth in SIPP has changed across the survey's 1996 and 2014 redesigns. See more about these data and terms below. Composition of total net worth owned by households in 2013  This section is partly based on Census Bureau research and the June 2017 report on improvements to measuring net worth of households. There are several findings based these on analyses. Home equity (the value of one's home minus all debts against it) has traditionally been the largest share of net worth. This trend continued in 2013 with home equity accounting for 32.2 percent of net worth owned by households. Retirement accounts were the second largest share of total net worth at 26.8 percent (16.3 percent in 401(k) and Thrift Savings Plan accounts and 10.5 percent in IRA and Keogh accounts). The cash value of life insurance policies accounted for 2.8 percent of net worth, annuities and trusts were 3.0 percent, and educational savings accounts were 0.4 percent of net worth owned by households in 2013. See related tables (Excel file) providing more detail on wealth and asset ownership. U.S. by State Net Worth and Related Measures, 2013 -- Interactive Table Mouse-over column header to view item description. Rank on any column by clicking column header; click again to sort other direction. See usage notes below table. See related interactive tables. Usage Notes • Click on a column header to sort on that column; click column header again to sort in other direction. • Click ShowAll button to show all areas and restore full set of data view; this resets to start-up view. • Navigate across rows/vertically in table: click in table on cell and arrow/page up/down or use scroll bar at right of table. • See related ranking tables. About Wealth & Net Worth Data -- goto top Household net worth (or household wealth) is the value of assets owned by household members minus the liabilities (debts) owed by household members. The major assets not covered in this measure are equities in pension plans and the value of home furnishings. See related table below "Assets and Liabilities Included in the Calculation of Net Worth" for more details on the components of net worth. A household consists of all people occupying a housing unit that is not part of a group quarter (such as a dorm, institution, or nursing home). Median household net worth is the dollar amount that divides households into two equal groups, one having net worth less than that amount and the other having net worth above that amount. The calculation of net worth includes two types of liabilities: secured liabilities (or secured debt), which is debt backed by an asset (such as a home loan or car loan), and unsecured liabilities (or unsecured debt), which is debt not backed by an asset (such as student loans or credit card bills). The Gini coefficient measures inequality across the whole of an area rather than simply comparing different wealth groups. If all the wealth went to a single household (maximum inequality) and and all other households got nothing, the Gini coefficient would be equal to 1. If wealth was shared equally, and all households got exactly the same, the Gini would equal 0. The lower the Gini value, the more equal the set of all households with respect to wealth. The Wealth Ratio measures how much households at one level of the wealth distribution have compared to households at another level. • 90/10 ratio - describes inequality between the top and the bottom • 90/50 ratio - describes inequality between the top and the middle • 50/10 ratio - describes inequality between the middle and the bottom of the income distribution Wealth Quintiles. A quintile is 20% of all households. If an area has 100,000 households, it can be separated into five quintiles of 20,000 each. The wealth index involves giving each household in an area a score which represents how wealthy households are based on the characteristics of their household. With this score, the "wealth quintiles" are created: households with the lowest 20% median net worth are in quintile one, the second lowest 20% into quintile two, the middle 20% into quintile three, the second wealthiest 20% into quintile four and the wealthiest 20% into quintile five. Assets and Liabilities Included in the Calculation of Net Worth -- goto top
ProximityOne User Group -- goto top Join the ProximityOne User Group to keep up-to-date with new developments relating to metros and component geography decision-making information resources. Receive updates and access to tools and resources available only to members. Use this form to join the User Group. Support Using these Resources Learn more about accessing and using demographic-economic data and related analytical tools. Join us in a Data Analytics Lab session. There is no fee for these one-hour Web sessions. Each informal session is focused on a specific topic. The open structure also provides for Q&A and discussion of application issues of interest to participants. Additional Information ProximityOne develops geodemographic-economic data and analytical tools and helps organizations knit together and use diverse data in a decision-making and analytical framework. We develop custom demographic/economic estimates and projections, develop geographic and geocoded address files, and assist with impact and geospatial analyses. Wide-ranging organizations use our tools (software, data, methodologies) to analyze their own data integrated with other data. Follow ProximityOne on Twitter at www.twitter.com/proximityone. Contact us (888-364-7656) with questions about data covered in this section or to discuss custom estimates, projections or analyses for your areas of interest. |
|
|