
|
|
U.S. by County Gross Domestic Product
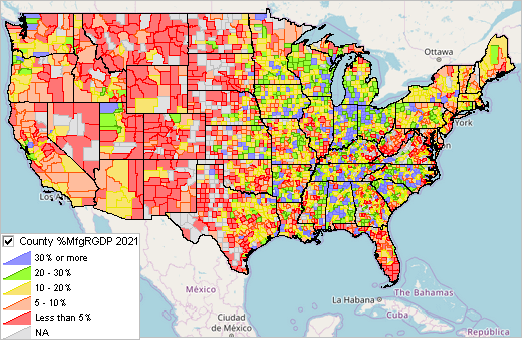
Gross Domestic Product (GDP) by county is a measure of the value of production that occurs within the geographic boundaries of a county. It can be computed as the sum of the value added originating from each of the industries in a county. GDP is the value of goods and services produced within a county. The size of a county's economy as measured by GDP varies considerably across the U.S. In 2021, real gross domestic product (GDP) increased in 2,404 counties, decreased in 691 counties, and was unchanged in 17 counties. The percent change in real GDP ranged from 81.8 percent in Coke County, TX to -34.8 percent in Chouteau County, MT. The total level of real GDP ranged from $11.7 million in Petroleum County, MT to $711.9 billion in Los Angeles County, CA. These data are based on estimates developed by the U.S. Bureau of Economic Analysis (BEA) and released in December 2022. This section is focused on U.S. national scope county level estimates of real Gross Domestic Product (GDP) annually 2001 through 2021. Use the interactive table below to rank, compare, query counties based on real GDP by sector. Data presented in this section are "real" values .. data that are inflation-adjusted statistics and exclude the effects of price changes. "Current-dollar" statistics, not shown in this section, are valued in the prices of the period when the transactions occurred .. at "market value" or "nominal GDP" or "current-price GDP." Presentation & Interpretative Notes The table below shows real GDP by sector for each state and county. The 34 rows for each county provide data for each sector and summary levels like "All industries." While the annual time series for these data runs from 2001 through 2021, only data for 2019, 2020 and 2021 are presented in the table below. As it is, the scope of tabular data are difficult to consume due to the volume and detail. These three recent years reflect pre-pandemic (2019), pandemic (2020) and post-pandemic (2021) or reasonably close. The change over time, comparison period, used in the table is 2019 compared to 2021. Different sectors in different counties were impacted in different and possible skewed ways in 2020. Many data items in the table have a negative value (-1) indicating that value was suppressed. The most common reason for data suppression is to avoid release of confidential information -- where there is a dominant firm is a particular sector. When there is suppression in a sector in a year, complimentary suppression will also occur in another sector in that year so that a suppressed value in one sector cannot be determined by summing and subtracting from total. Patterns of 2021 Manufacturing Real GDP by County The graphic below shows patterns of 2021 manufacturing sector real GDP as a percent of total real GDP by county.  - View developed using ProximityOne CV XE GIS and related GIS project. - create custom views; add your own data, using the GIS project. U.S. by County Gross Domestic Product 2019-2021 .. interactive table .. goto top Click ShowAll button between Find/Queries. Use mouseover on column header to view column description. See usage notes below table. Real GDP in thousands of 2012 dollars. See related tables -- interactive tables. Usage Notes • If table not showing any rows; click ShowAll button below table. • Use vertical and horizontal scroll bars to navigate up/down or left/right. • Adjust column widths using column divider between header cells. • StCty> button -- use to select one county -- one row appears in grid. .. get county 5-character code here .. paste the 5-character county code in the edit box to right of StCty> button. .. overwriting the value 48113. .. click the StCty> button ... table refreshes with the selected county. • Find Name> button -- use to select area based on exact spelling of partial name in column 1. .. Key in exact up/low case spelling of partial name of area in the edit box to right of Find Name> button. .. overwriting the value Dallas. .. click the Find Name> button ... table refreshes with all areaa with matched spelling in column 1. • Group1 selected columns .. click "All columns" button to restore view to all columns. • All items are based on GDP 2022 vintage estimates. • Click ShowAll button between specific area queries. • Cells with negative value could not be estimated (for this geography and this time frame). ProximityOne User Group Join the ProximityOne User Group to keep up-to-date with new developments relating to metros and component geography decision-making information resources. Receive updates and access to tools and resources available only to members. Use this form to join the User Group. Support Using these Resources Learn more about accessing and using demographic-economic data and related analytical tools. Join us in a Data Analytics Lab session. There is no fee for these one-hour Web sessions. Each informal session is focused on a specific topic. The open structure also provides for Q&A and discussion of application issues of interest to participants. Additional Information ProximityOne develops geodemographic-economic data and analytical tools and helps organizations knit together and use diverse data in a decision-making and analytical framework. We develop custom demographic/economic estimates and projections, develop geographic and geocoded address files, and assist with impact and geospatial analyses. Wide-ranging organizations use our tools (software, data, methodologies) to analyze their own data integrated with other data. Follow ProximityOne on Twitter at www.twitter.com/proximityone. Contact us (888-364-7656) with questions about data covered in this section or to discuss custom estimates, projections or analyses for your areas of interest. |
|
|