
|
|
|
- examining Hispanic demographics by county The Hispanic or Latino population group is comprised of many specific origin subgroups. The specific origin subgroups are often associated with different regions of the world. Many specific origin subgroups tend to cluster by location within the U.S. both as a result of the geography of emigration (e.g., Mexico to Texas) and association with where same subgroup emigrants have settled (e.g., Cuba to New York). This section provides insights into how the Hispanic specific origin subgroups are distributed across the U.S. by county. Tools are provided to analyze geographic and subgroup patterns of interest. Census 2010 identifies approximately 70 Hispanic specific origin subgroups (see list). The table presented below shows the U.S. Census 2010 Hispanic population for a summary of these specific origin subgroups organized into 28 more aggregated groups. The Census 2010 population by county for these same 28 subgroups is presented in an interactive table below in this section. Related sections • Hispanic Population by Specific Origin by ZIP Code • Foreign Born Population by Country of Origin by Census Tract .. many Hispanic dominant countries; 162 countries/country combinations Hispanic Population by Specific Origin by County: Census 2010 Scroll section ... 63% of the Census 2010 Hispanic population is Mexican.
Visual Pattern Analysis with GIS Tools -- scroll section Thematic pattern views below show selected Hispanic specific origin groups. Patterns are shown in the legend at left of map. The color/interval shows the percent of the total of the Hispanic specific origin in each county. Counties with fewer than 1,000 population in the Hispanic specific origin group are not shown (fifth interval). Maps developed with CVGIS software and related GIS project/datasets. Click graphic for lager view. Install CVGIS and GIS project for flexible analysis; add your own data. Create difference views. Mexican 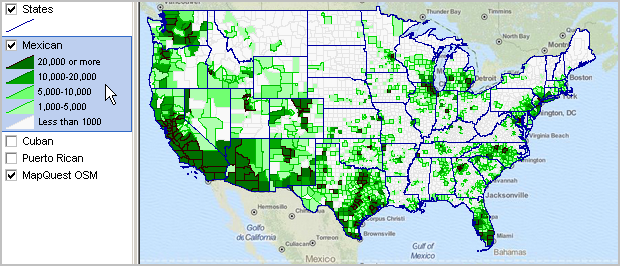
Cuban 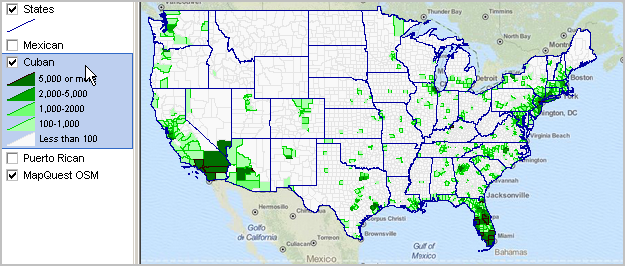
Puerto Rican 
Hispanic Population by Specific Origin by County -- interactive table Click column header to sort; click again to sort other direction. See related interactive tables Table Notes and Usage Table Columns - scroll section
- County Name
- State postal abbreviation - State FIPS code - County FIPS code - CBSA code - Metro division code - Total Population - Not Hispanic or Latino - Hispanic or Latino - Percent Hispanic - Mexican (210-220) - Puerto Rican (260-269) - Cuban (270-274) - Dominican (275-279) - Central American (excluding Mexican) (221-230): - Costa Rican (221) - Guatemalan (222) - Honduran (223) - Nicaraguan (224) - Panamanian (225) - Salvadoran (226) - Other Central American (227-230) - South American (231-249): - Argentinean (231) - Bolivian (232) - Chilean (233) - Colombian (234) - Ecuadorian (235) - Paraguayan (236) - Peruvian (237) - Uruguayan (238) - Venezuelan (239) - Other South American (240-249) - Other Hispanic (200-209, 250-259, 280-299): - Spaniard (200-209) - Spanish (282) - Spanish American (286) - All other Hispanic Table Operations • Click ShowAll button between specific queries. • Click on a column header to sort ascending/descending on that column. • Use State dropdown box below table to select/filter on a state. • Use Find in Name to find an area based on partial case-sensitive name. - Click ShowAll button first. - Key in any part of name and click Find in Name button. - Search will filter for any name with that exact, case sensitive, spelling. - San Diego is used as an example. Hispanic by Specific Origin Categories and Codes
HISPANIC OR LATINO ORIGIN
200-209 SPANIARD 200 Spaniard 201 Andalusian 202 Asturian 203 Castillian 204 Catalonian 205 Balearic Islander 206 Gallego 207 Valencian 208 Canarian 209 Spanish Basque 210-220 MEXICAN 210 Mexican (Checkbox) 211 Mexican 212 Mexican American 213 Mexicano 214 Chicano 215 La Raza 216 Mexican American Indian 218 Mexico 219 Mexican Indian 221-230 CENTRAL AMERICAN 221 Costa Rican 222 Guatemalan 223 Honduran 224 Nicaraguan 225 Panamanian 226 Salvadoran 227 Central American 228 Central American Indian 229 Canal Zone 231-249 SOUTH AMERICAN 231 Argentinean 232 Bolivian 233 Chilean 234 Colombian 235 Ecuadorian 236 Paraguayan 237 Peruvian 238 Uruguayan 239 Venezuelan 240 South American Indian 241 Criollo 242 South American 250-259 LATIN AMERICAN 250 Latin American 251 Latin 252 Latino 260-269 PUERTO RICAN 260 Puerto Rican (Checkbox) 261 Puerto Rican 270-274 CUBAN 270 Cuban (Checkbox) 271 Cuban 275-279 DOMINICAN 275 Dominican 280-299 OTHER HISPANIC/SPANISH 280 Other Hispanic/Spanish (Checkbox) 281 Hispanic 282 Spanish 283 Californio 284 Tejano 285 Nuevo Mexicano 286 Spanish American 287 Spanish American Indian 288 Meso American Indian 289 Mestizo 290 Caribbean 299 Other Hispanic/Spanish, not elsewhere classified Support Using these Resources Learn more about accessing and using demographic-economic data and related analytical tools. Join us in a Data Analytics Lab session. There is no fee for these one-hour Web sessions. Each informal session is focused on a specific topic. The open structure also provides for Q&A and discussion of application issues of interest to participants. ProximityOne User Group Join the ProximityOne User Group to keep up-to-date with new developments relating to geographic-demographic-economic decision-making information resources. Receive updates and access to tools and resources available only to members. Use this form to join the User Group. Additional Information ProximityOne develops geographic-demographic-economic data and analytical tools and helps organizations knit together and use diverse data in a decision-making and analytical framework. We develop custom demographic/economic estimates and projections, develop geographic and geocoded address files, and assist with impact and geospatial analyses. Wide-ranging organizations use our tools (software, data, methodologies) to analyze their own data integrated with other data. Follow ProximityOne on Twitter at www.twitter.com/proximityone. Contact ProximityOne (888-364-7656) with questions about data covered in this section or to discuss custom estimates, projections or analyses for your areas of interest. |
|
|
